Fig. A.3.
Download original image
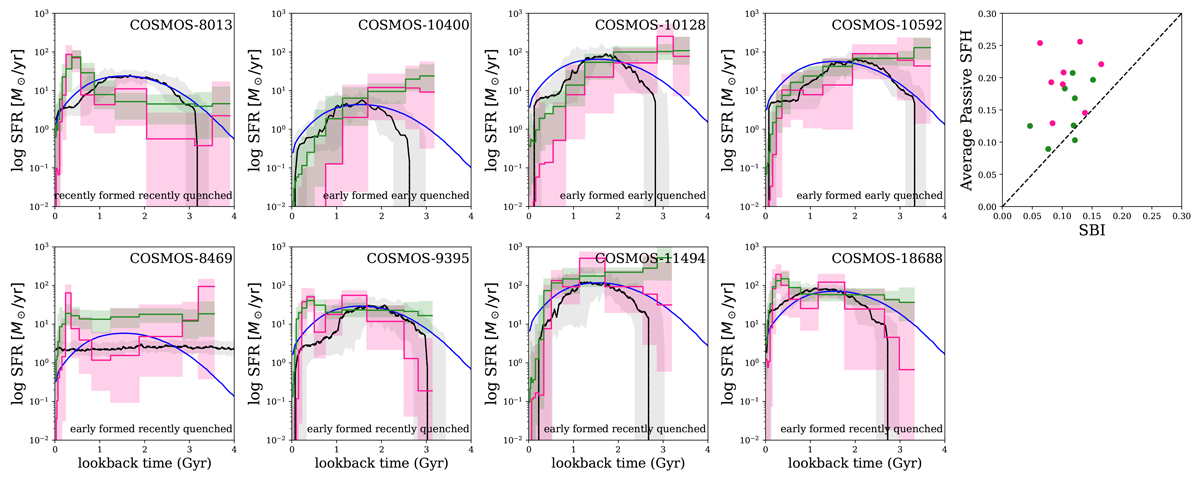
Comparison of SFH estimates for individual galaxies in the Park et al. (2024) sample. The shaded green regions shows the results using the continuity prior, in pink using the bursty prior, and in black our SBI estimate. The blue line shows the average SFH of passive galaxies. The size of the shaded regions corresponds to the 68% confidence intervals. The top right panel shows the median residuals between the the Park et al. (2024) estimates and either our SBI estimate (horizontal axes) or the average passive SFH (vertical axes). The points above the diagonal line indicate our method is closer to Prospector's estimate than the average passive SFH is.
Current usage metrics show cumulative count of Article Views (full-text article views including HTML views, PDF and ePub downloads, according to the available data) and Abstracts Views on Vision4Press platform.
Data correspond to usage on the plateform after 2015. The current usage metrics is available 48-96 hours after online publication and is updated daily on week days.
Initial download of the metrics may take a while.