Open Access
Fig. A.2.
Download original image
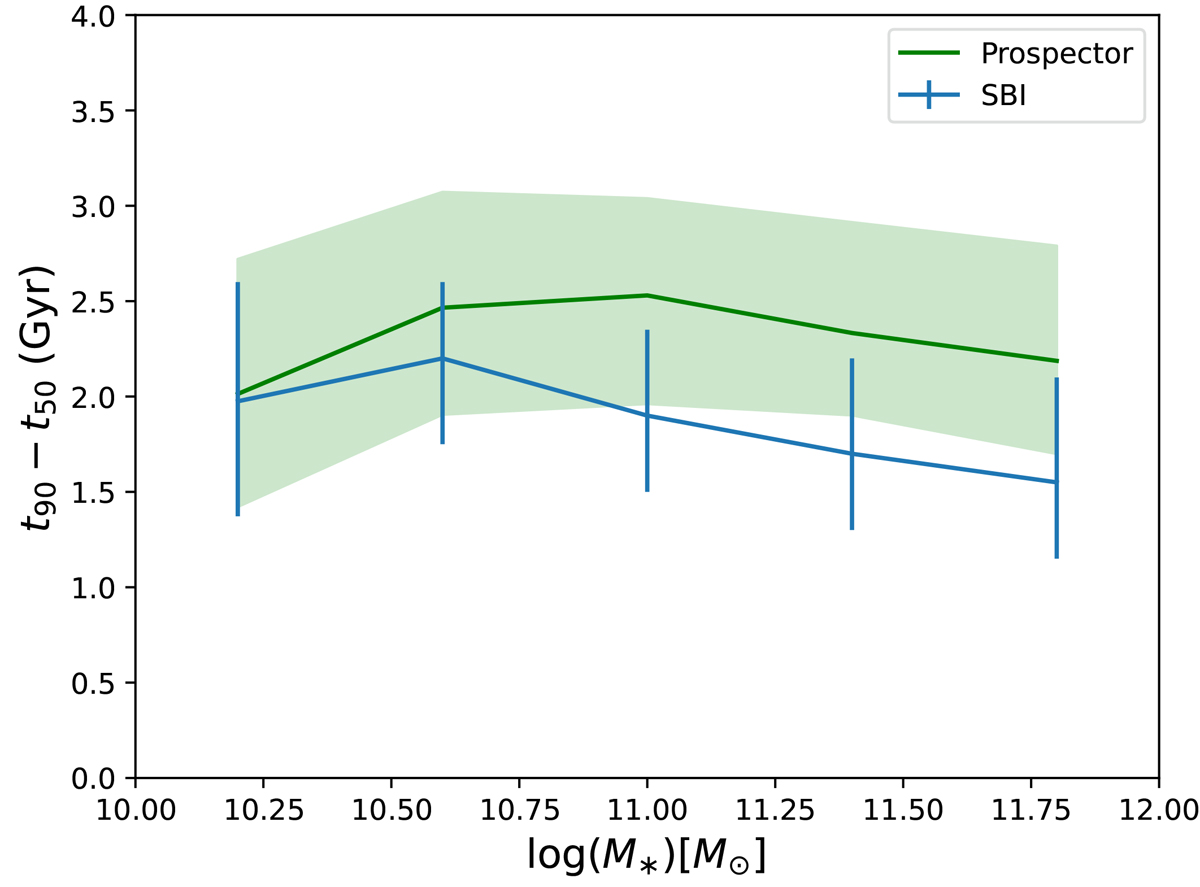
Variation of t90−t50 as a function of mass, estimated with Prospector (green) by Kaushal et al. (2024), and with our SBI method (blue). Error bars and shaded regions represent the 16th-84th confidence intervals.
Current usage metrics show cumulative count of Article Views (full-text article views including HTML views, PDF and ePub downloads, according to the available data) and Abstracts Views on Vision4Press platform.
Data correspond to usage on the plateform after 2015. The current usage metrics is available 48-96 hours after online publication and is updated daily on week days.
Initial download of the metrics may take a while.