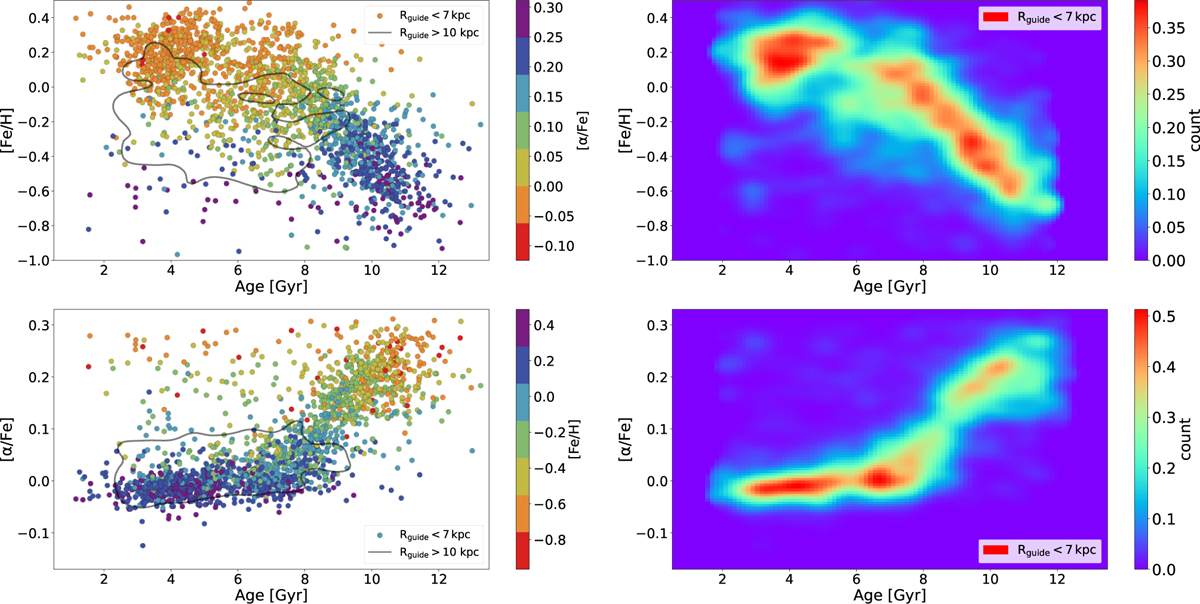
Fig. 6
Download original image
Age-[Fe/H] and age-[α/Fe] distributions for our subsamples of inner disk stars, as defined by limiting Rguide below 7 kpc. Scatter plots are on the left, while column normalized density plots are on the right. In the scatter plots, the stars are color-coded for their metallicity and [α/Fe] content, while with the black 30% level iso-density contour we show the outer disk stars selected as Rguide greater than 10 kpc.
Current usage metrics show cumulative count of Article Views (full-text article views including HTML views, PDF and ePub downloads, according to the available data) and Abstracts Views on Vision4Press platform.
Data correspond to usage on the plateform after 2015. The current usage metrics is available 48-96 hours after online publication and is updated daily on week days.
Initial download of the metrics may take a while.