Fig. 4
Download original image
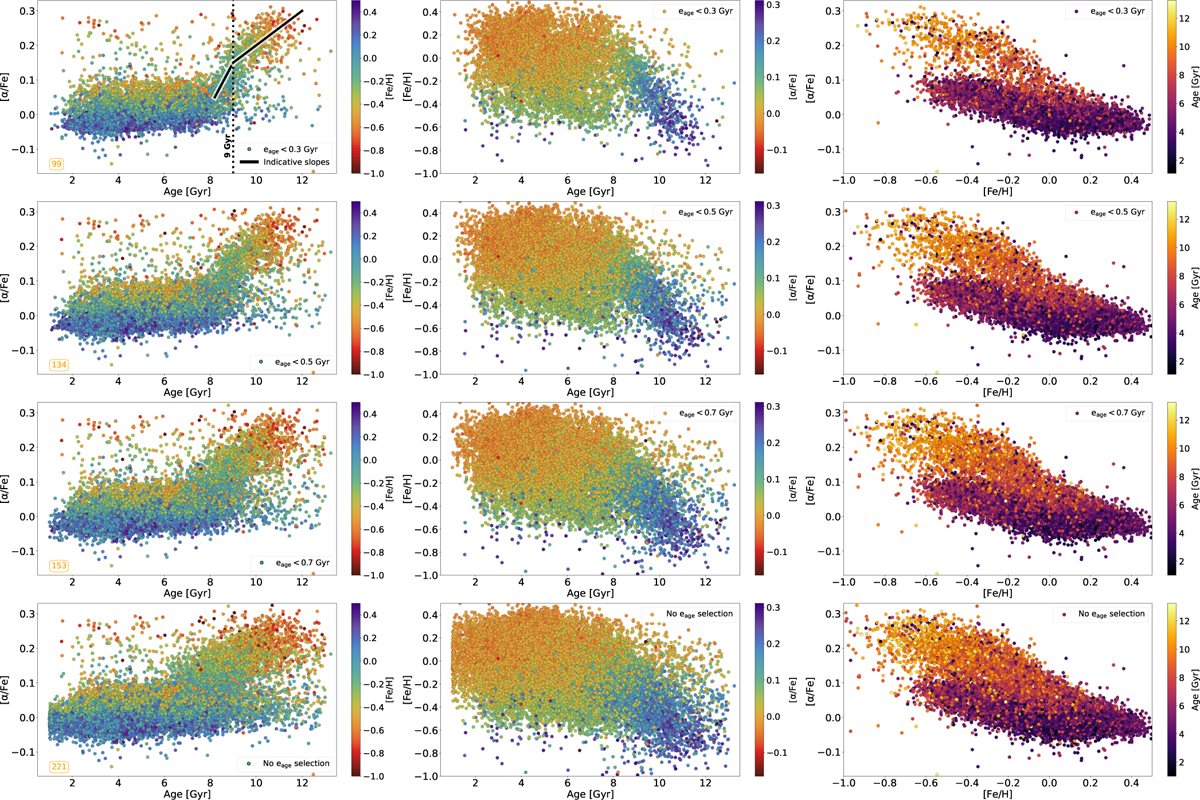
Effect of the age uncertainties on the age-[α/Fe] distribution (left column), age-metallicity distribution (middle column), and [α/Fe]-[Fe/H] distribution (right column) for APOGEE DR17 local dwarfs. The ages in this case were obtained with the observational input G absolute magnitude, MG0, and Gaia DR3 de-reddened color (Bp - Rp)0. The stars in these plots were selected to have ages above 1 Gyr, [Fe/H] lower than −1 dex, and (BP - RP)0 lower than 0.95. We compare three different cuts: eage < 0.3 Gyr, eage < 0.5 Gyr, eage < 0.7 Gyr with the total distribution to which no selection on age uncertainty is applied (bottom row). The stars are color-coded for [Fe/H], [α/Fe], and age, respectively. The number of candidate YARs (with age below 7 Gyr and [α/Fe] above 0.12 dex) is written in orange in each age-[α/Fe] panel. Black lines are plotted in the age-[α/Fe] relation for stars with eage < 0.3 Gyr to highlight the presence of two distinct slopes in the thick disk sequence. We note that the age scale in this image may be shifted by 1-2 Gyr toward older ages if the age scale from Nissen et al. (2020) is correct when making comparisons (see Section 2.4 and Fig. 3).
Current usage metrics show cumulative count of Article Views (full-text article views including HTML views, PDF and ePub downloads, according to the available data) and Abstracts Views on Vision4Press platform.
Data correspond to usage on the plateform after 2015. The current usage metrics is available 48-96 hours after online publication and is updated daily on week days.
Initial download of the metrics may take a while.