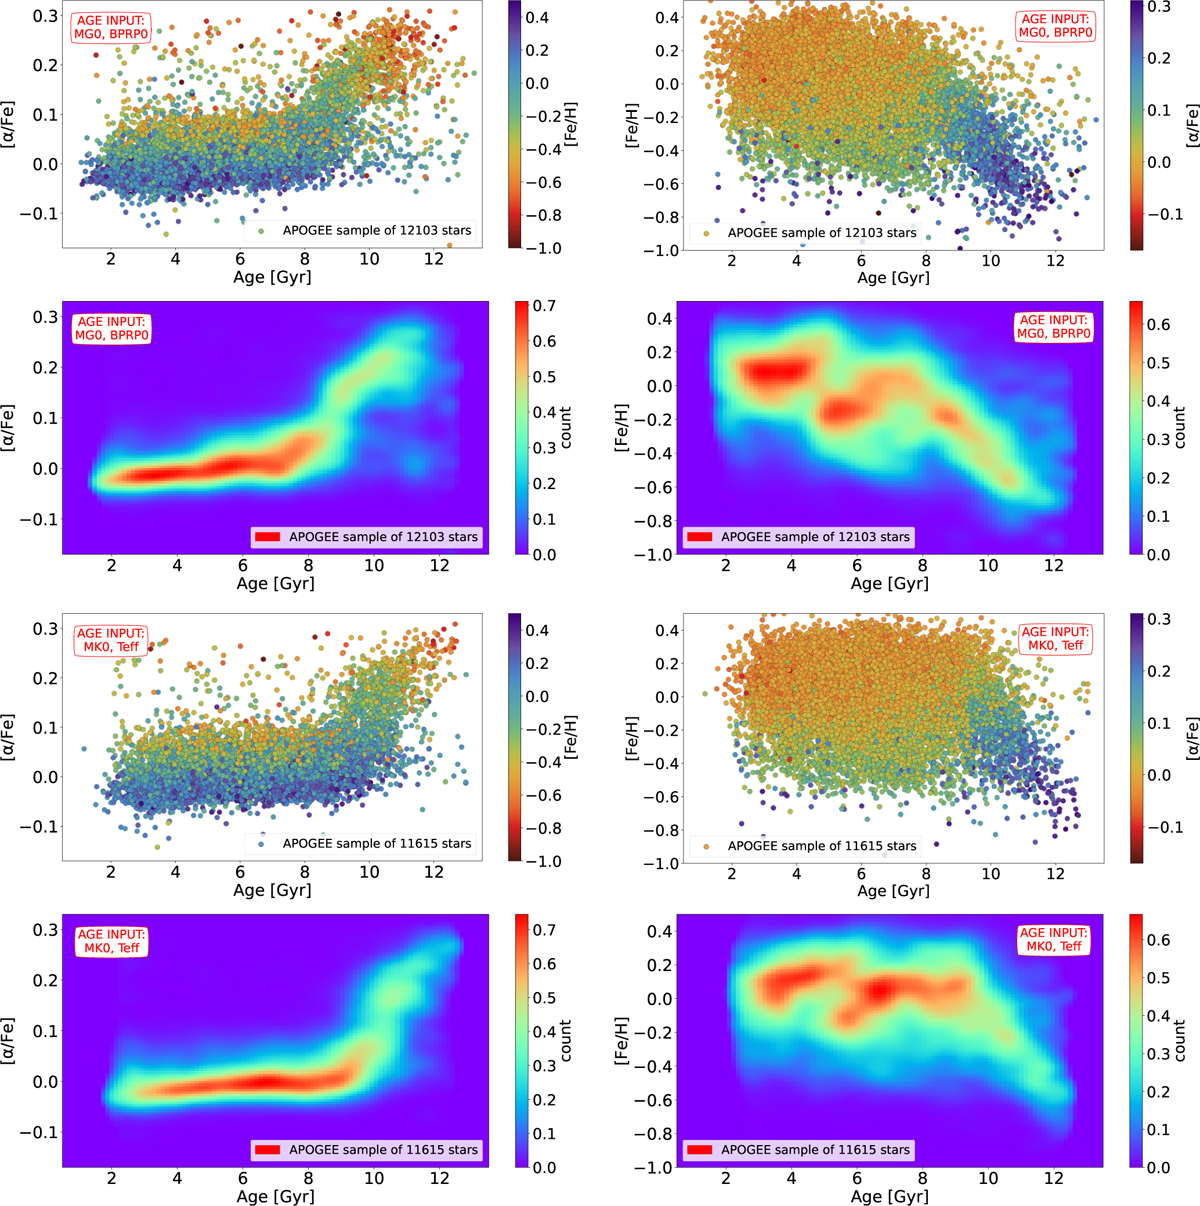
Fig. 2
Download original image
[α/Fe] (left) and age-[Fe/H] (right) distributions for APOGEE DR17 dwarfs in the form of scatter plots and density distributions. In the top four plots, the ages were determined using Bp-Rp color and Gaia G absolute magnitude, while in the bottom four plots, the ages were determined from Ks magnitudes and Teff effective temperatures. The number of stars in each subsample is indicated inside each density plot (see text for details about the selection of the each subsample).
Current usage metrics show cumulative count of Article Views (full-text article views including HTML views, PDF and ePub downloads, according to the available data) and Abstracts Views on Vision4Press platform.
Data correspond to usage on the plateform after 2015. The current usage metrics is available 48-96 hours after online publication and is updated daily on week days.
Initial download of the metrics may take a while.