Fig. 12
Download original image
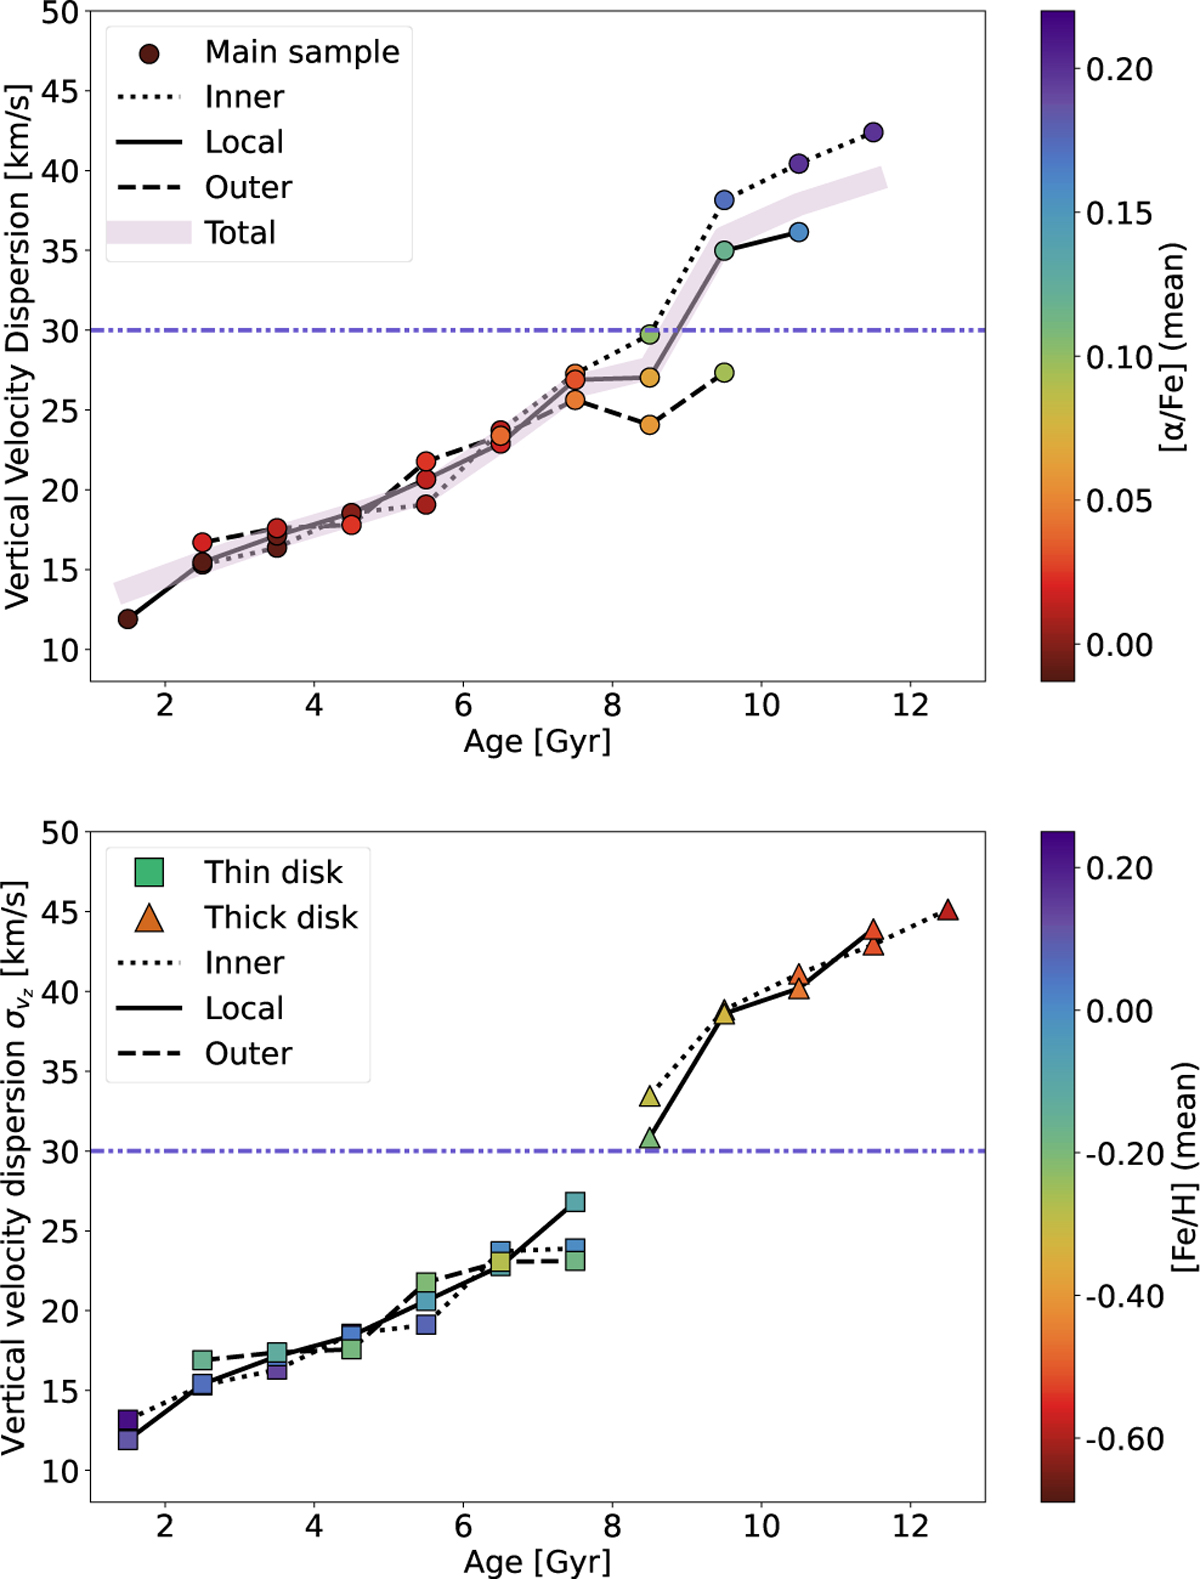
Vertical velocity dispersion (σz) of the inner, local, and outer subsamples as a function of stellar ages. In the top panel we display the relation obtained for the main sample; in the bottom panels we show the relation representative of the thick disk selected with [α/Fe] > 0.10 and age older than 8 Gyr (triangles) and the thin disk sample selected with [α/Fe] < 0.10 dex and age younger than 8 Gyr (squares). This selection allows us to avoid the region in which the thin and thick disk populations mix and the possible YAR candidates. σz is determined for 1 Gyr age bins and the points are plotted in the middle of each bin. The colorcoding indicates the mean of the individual [α/Fe] (top and middle) and [Fe/H] (bottom) of the stars in each bin. For each population, the bin with the fraction of stars exceeding 1% of the total number of stars is shown. The pink thick line represents the global trend of the main sample. A blue line at σz = 30 km/s is also shown for reference.
Current usage metrics show cumulative count of Article Views (full-text article views including HTML views, PDF and ePub downloads, according to the available data) and Abstracts Views on Vision4Press platform.
Data correspond to usage on the plateform after 2015. The current usage metrics is available 48-96 hours after online publication and is updated daily on week days.
Initial download of the metrics may take a while.