Fig. 1
Download original image
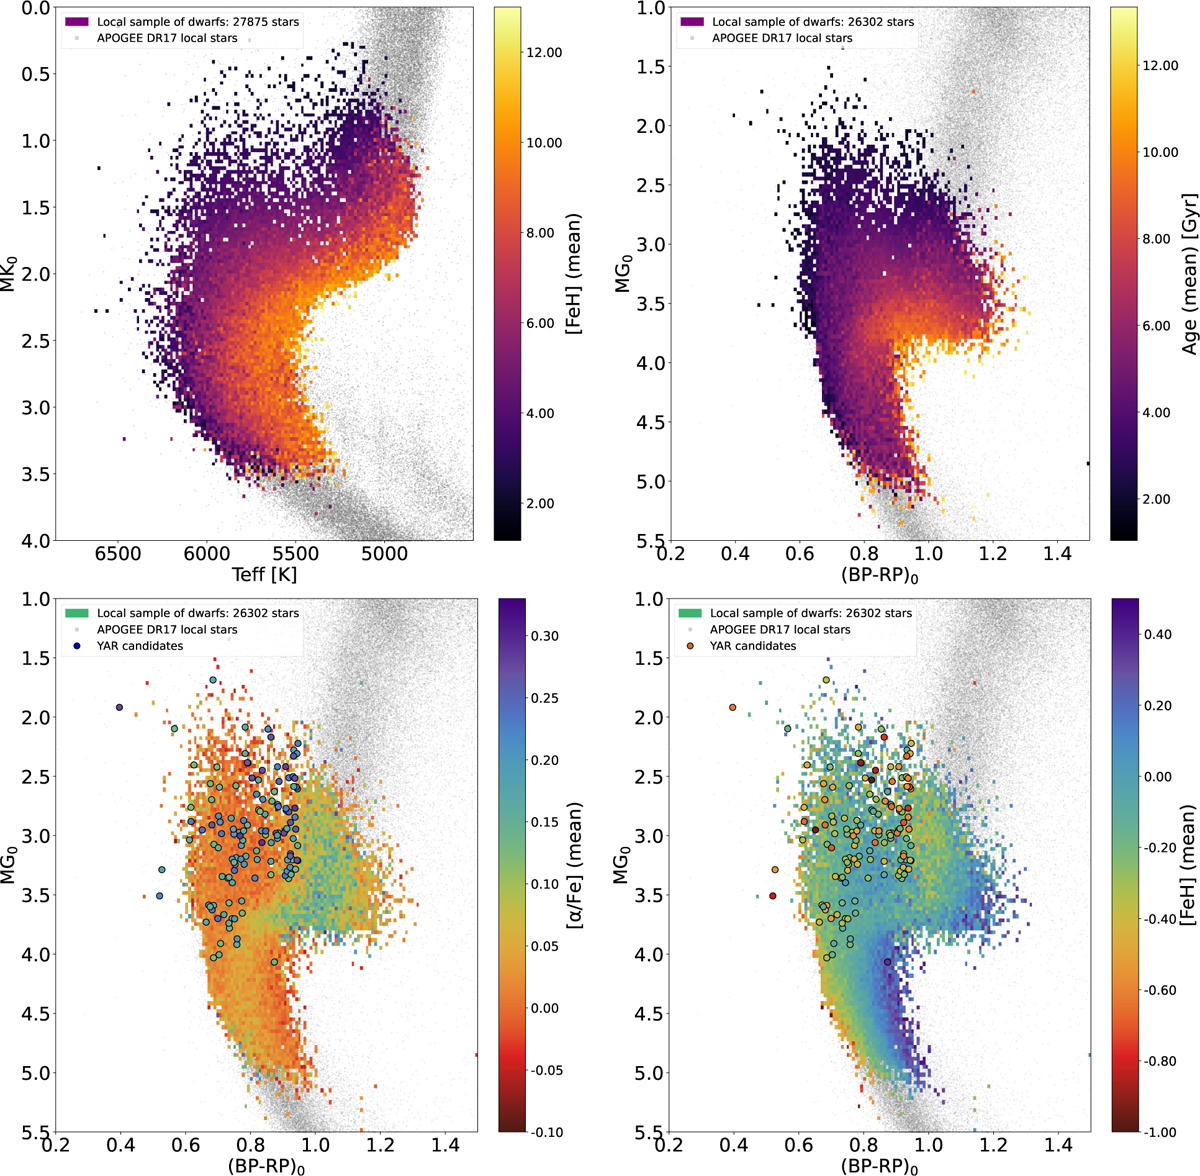
MK0 - Teff plane (upper left) and Gaia photometry color-magnitude diagram (upper right, bottom left, and bottom right) for stars in APOGEE DR17. The local sample of dwarfs is highlighted by the color-coding by age (upper panels), [α/Fe] (bottom left), and [Fe/H] (bottom right), while the rest of the stars (within 2 kpc of the Sun) is underplotted in gray. In the bottom panels we additionally overplot young alpha-rich candidates we find in our sample (see Section 3). The details about the correction for reddening and extinction of the 2MASS and Gaia photometry are given in the text.
Current usage metrics show cumulative count of Article Views (full-text article views including HTML views, PDF and ePub downloads, according to the available data) and Abstracts Views on Vision4Press platform.
Data correspond to usage on the plateform after 2015. The current usage metrics is available 48-96 hours after online publication and is updated daily on week days.
Initial download of the metrics may take a while.