Fig. 9
Download original image
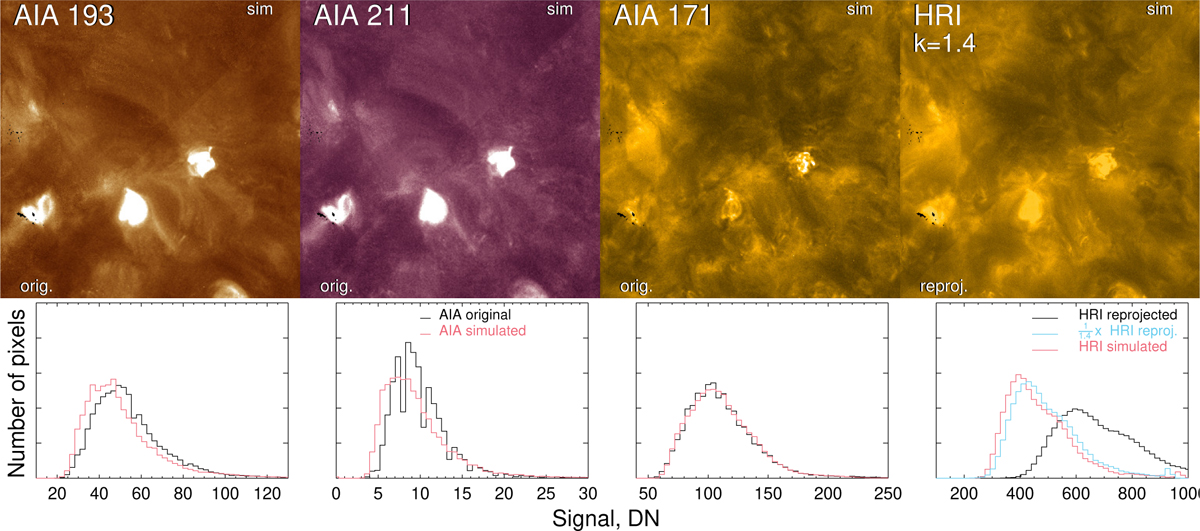
Comparison of real and simulated images for AIA 193, 211, and 171 Å channels (from left to right, top row) and HRIEUV (top right panel) for the cross-calibration factor k = 1.4 for 30 May 2020. Each panel is split into two parts with the simulated part (top left) and the real part (bottom right) part. The FOV of these images is shown in Fig. 1. The plots under each panel show the histograms of the signal.
Current usage metrics show cumulative count of Article Views (full-text article views including HTML views, PDF and ePub downloads, according to the available data) and Abstracts Views on Vision4Press platform.
Data correspond to usage on the plateform after 2015. The current usage metrics is available 48-96 hours after online publication and is updated daily on week days.
Initial download of the metrics may take a while.