Fig. 7
Download original image
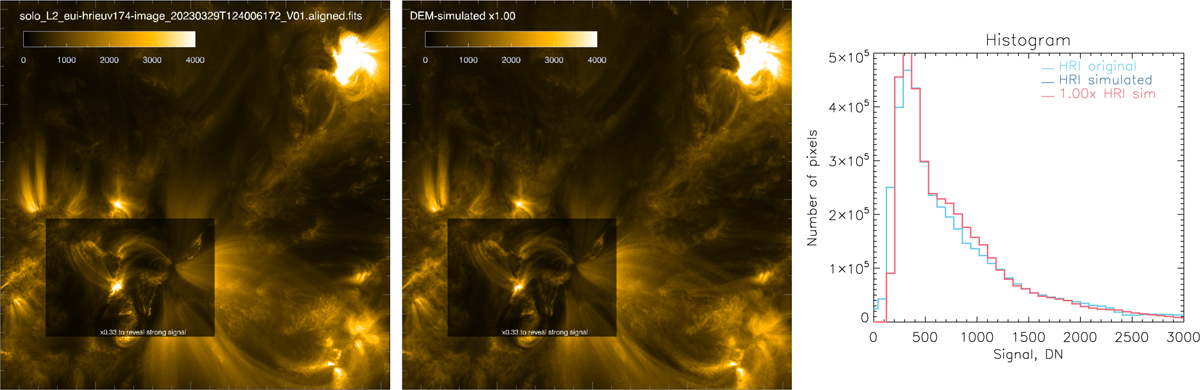
Comparison of real HRIEUV image taken on 29 March, 2023 (left) and a simulated one (middle) calculated using DEM. The histograms are shown in the right panel. There was no need to introduce the additional cross-calibration factor k for this date. In the dark rectangle of the image, the signal was normalized by ×0.33 for visualization purposes. An animated comparison is available online.
Current usage metrics show cumulative count of Article Views (full-text article views including HTML views, PDF and ePub downloads, according to the available data) and Abstracts Views on Vision4Press platform.
Data correspond to usage on the plateform after 2015. The current usage metrics is available 48-96 hours after online publication and is updated daily on week days.
Initial download of the metrics may take a while.