Fig. 5
Download original image
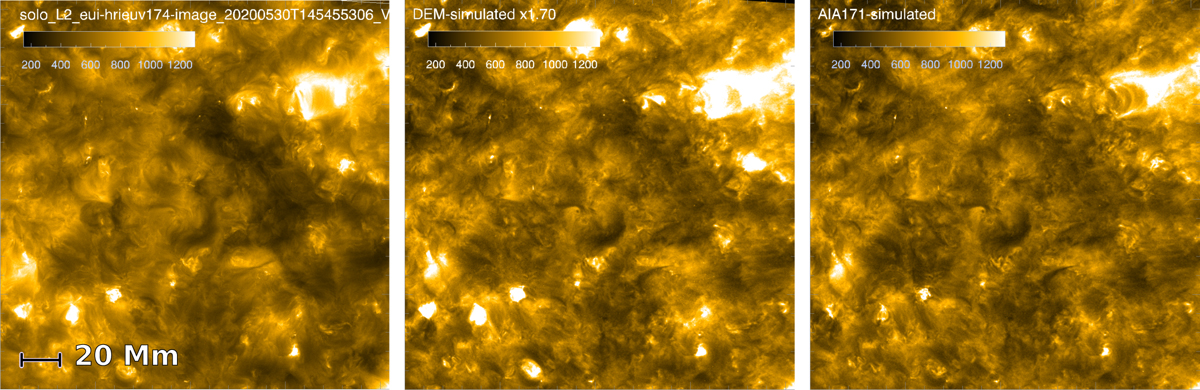
Comparison of real HRIEUV image taken on 30 May, 2020 (left), simulated one calculated using DEM (middle), and AIA 171 Å image re-projected to HRIEUV pixel grid and re-normalized (right). The DEM was obtained using six channels - 94, 131, 171, 193, 211, and 335 Å - of the AIA telescope; then, the DEM was multiplied by GHRI(T). The resulting image was re-projected to the HRIEUV pixel grid, and finally the additional empirical coefficient k = 1.7 was used. For the AIA 171 Å, a coefficient k = 5.5 was used. An animated comparison is available online.
Current usage metrics show cumulative count of Article Views (full-text article views including HTML views, PDF and ePub downloads, according to the available data) and Abstracts Views on Vision4Press platform.
Data correspond to usage on the plateform after 2015. The current usage metrics is available 48-96 hours after online publication and is updated daily on week days.
Initial download of the metrics may take a while.