Fig. 2
Download original image
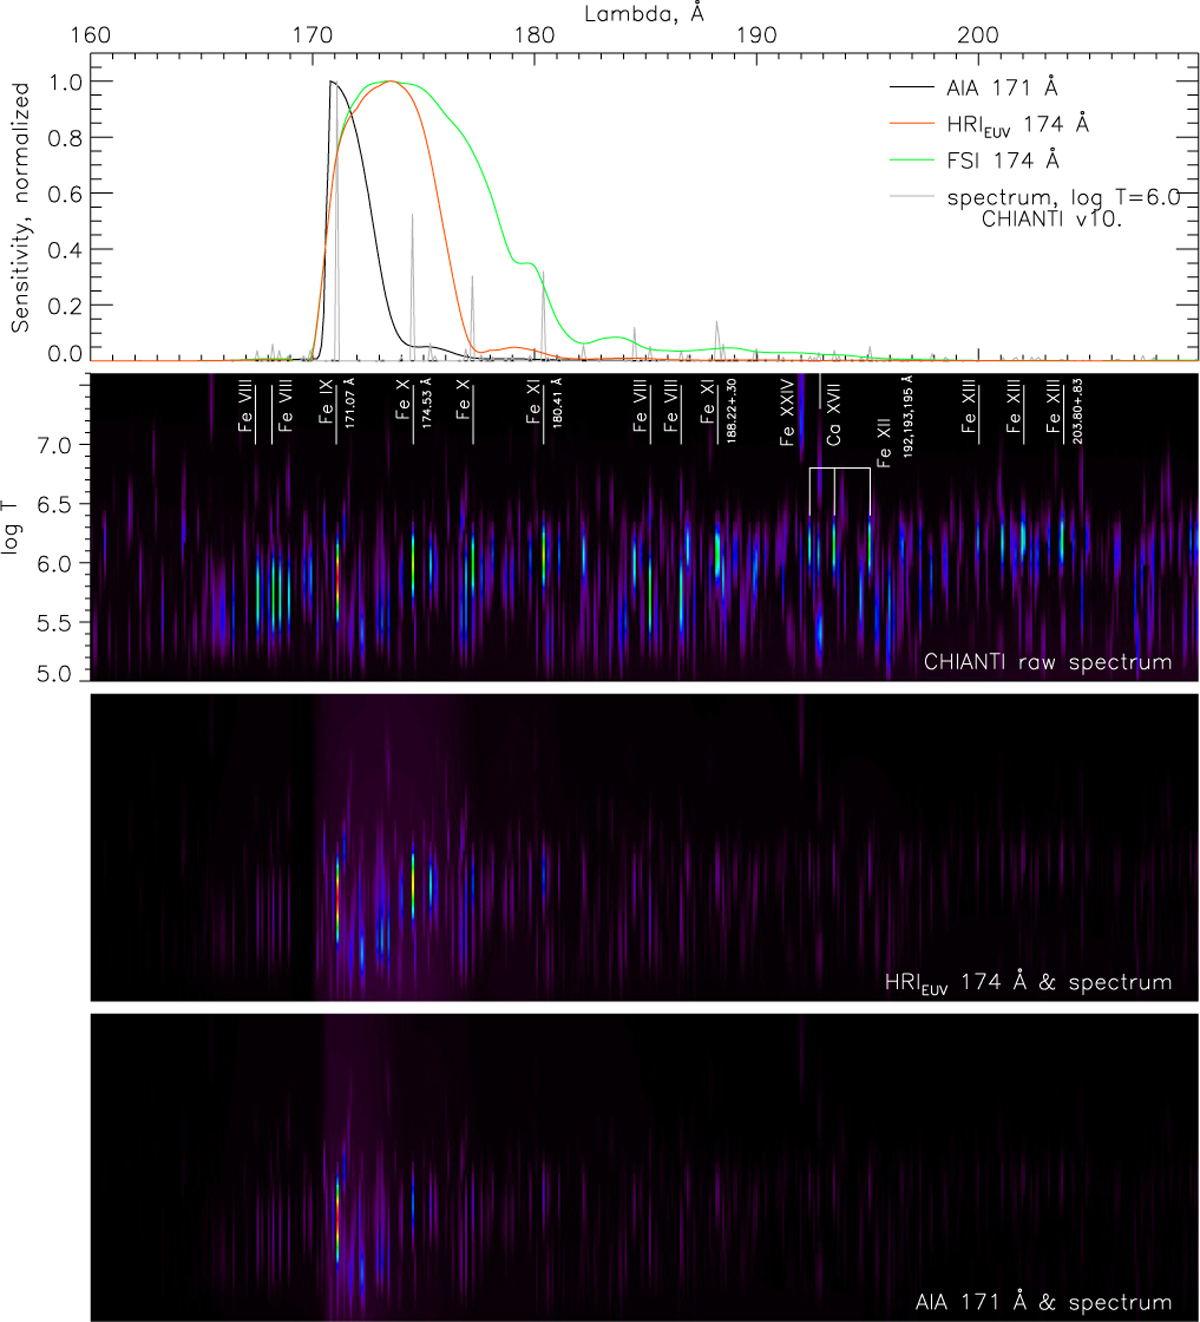
Spectral responses of AIA 171 Å telescope and HRIEUV telescopes (top panel); the emission spectra calculated for different temperatures (second panel) and bottom two panels show the same spectra but multiplied with spectral responses of the telescopes. In the three bottom panels, the vertical coordinate corresponds to log T (see further explanations in the main text).
Current usage metrics show cumulative count of Article Views (full-text article views including HTML views, PDF and ePub downloads, according to the available data) and Abstracts Views on Vision4Press platform.
Data correspond to usage on the plateform after 2015. The current usage metrics is available 48-96 hours after online publication and is updated daily on week days.
Initial download of the metrics may take a while.