Open Access
Fig. 15
Download original image
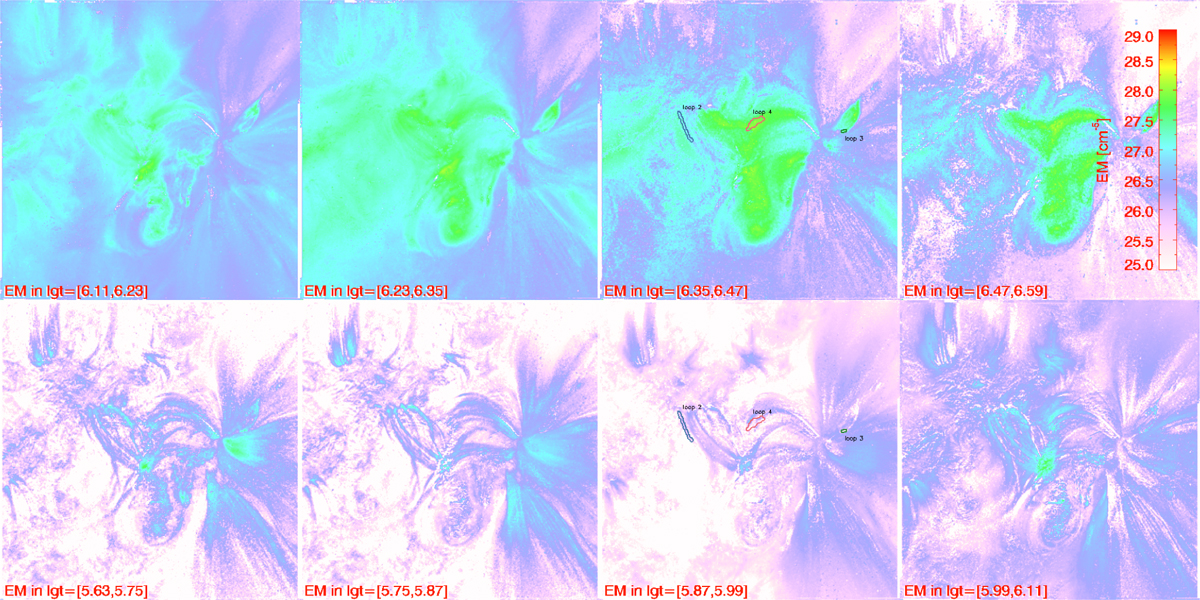
Two-dimensional map of emission measure EMTi in different temperature bins for 29 March 2023, calculated for k = 1.4. The temperature bin of each panel is annotated in the lower left corner. In the panels of the third column, several loops are annotated and were analyzed in detail.
Current usage metrics show cumulative count of Article Views (full-text article views including HTML views, PDF and ePub downloads, according to the available data) and Abstracts Views on Vision4Press platform.
Data correspond to usage on the plateform after 2015. The current usage metrics is available 48-96 hours after online publication and is updated daily on week days.
Initial download of the metrics may take a while.