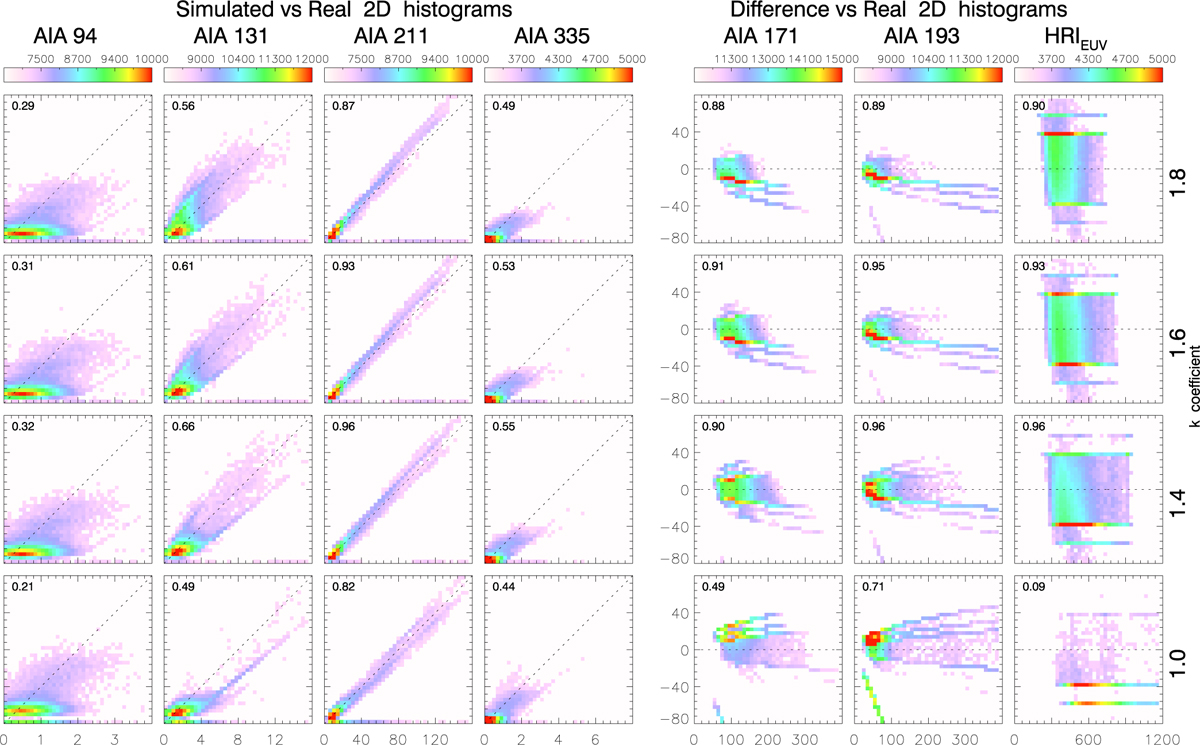
Fig. 10
Download original image
Two-dimensional histograms of “simulated-versus-real” and “difference-versus-real” signals for different spectral channels of AIA and HRIEUV (annotated on top) for different cross-calibration values of k (annotated on the right) for observations on 30 May 2020. In each panel, the horizontal axis represents the intensity of the real image, the vertical axis represents the intensity of either the simulated image or the simulated-real difference, and the color encodes the number of occurrences in the given pair of images. For perfectly coinciding images, the simulated-versus-real signal should be a straight diagonal line, while for the difference-versus-real one it should be a horizontal line.
Current usage metrics show cumulative count of Article Views (full-text article views including HTML views, PDF and ePub downloads, according to the available data) and Abstracts Views on Vision4Press platform.
Data correspond to usage on the plateform after 2015. The current usage metrics is available 48-96 hours after online publication and is updated daily on week days.
Initial download of the metrics may take a while.