Fig. 1
Download original image
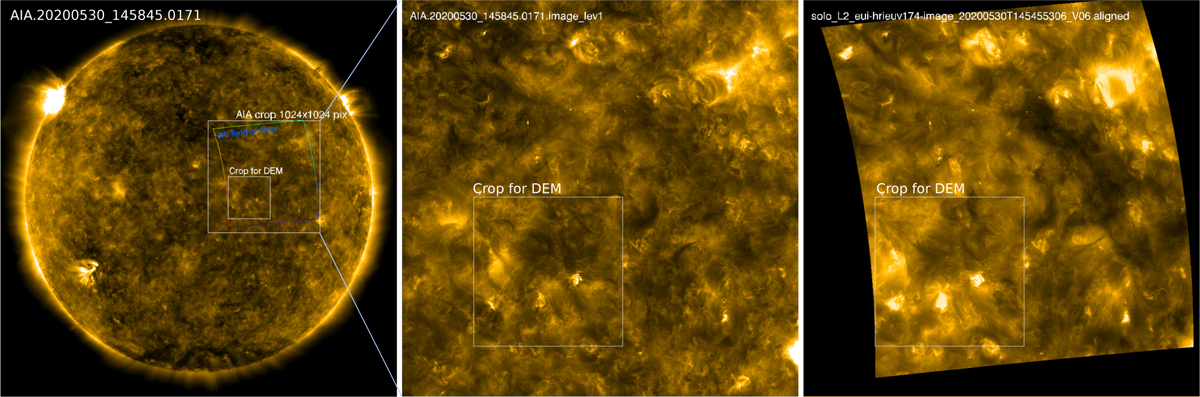
AIA and HRIEUV images registered on 30 May, 2020 near 14:58 UTC. The panels show the real AIA 171 Å image (left), a zoomed-in view of the AIA region (middle), and the re-projected HRIEUV image (right). In the left panel, the zoomed-in view and the HRIEUV FOV are denoted by the outer white square and the color curve. The inner white square in the left panel and white squares in the middle and right panels denote the region used in the mutual DEM analysis.
Current usage metrics show cumulative count of Article Views (full-text article views including HTML views, PDF and ePub downloads, according to the available data) and Abstracts Views on Vision4Press platform.
Data correspond to usage on the plateform after 2015. The current usage metrics is available 48-96 hours after online publication and is updated daily on week days.
Initial download of the metrics may take a while.