Fig. 9
Download original image
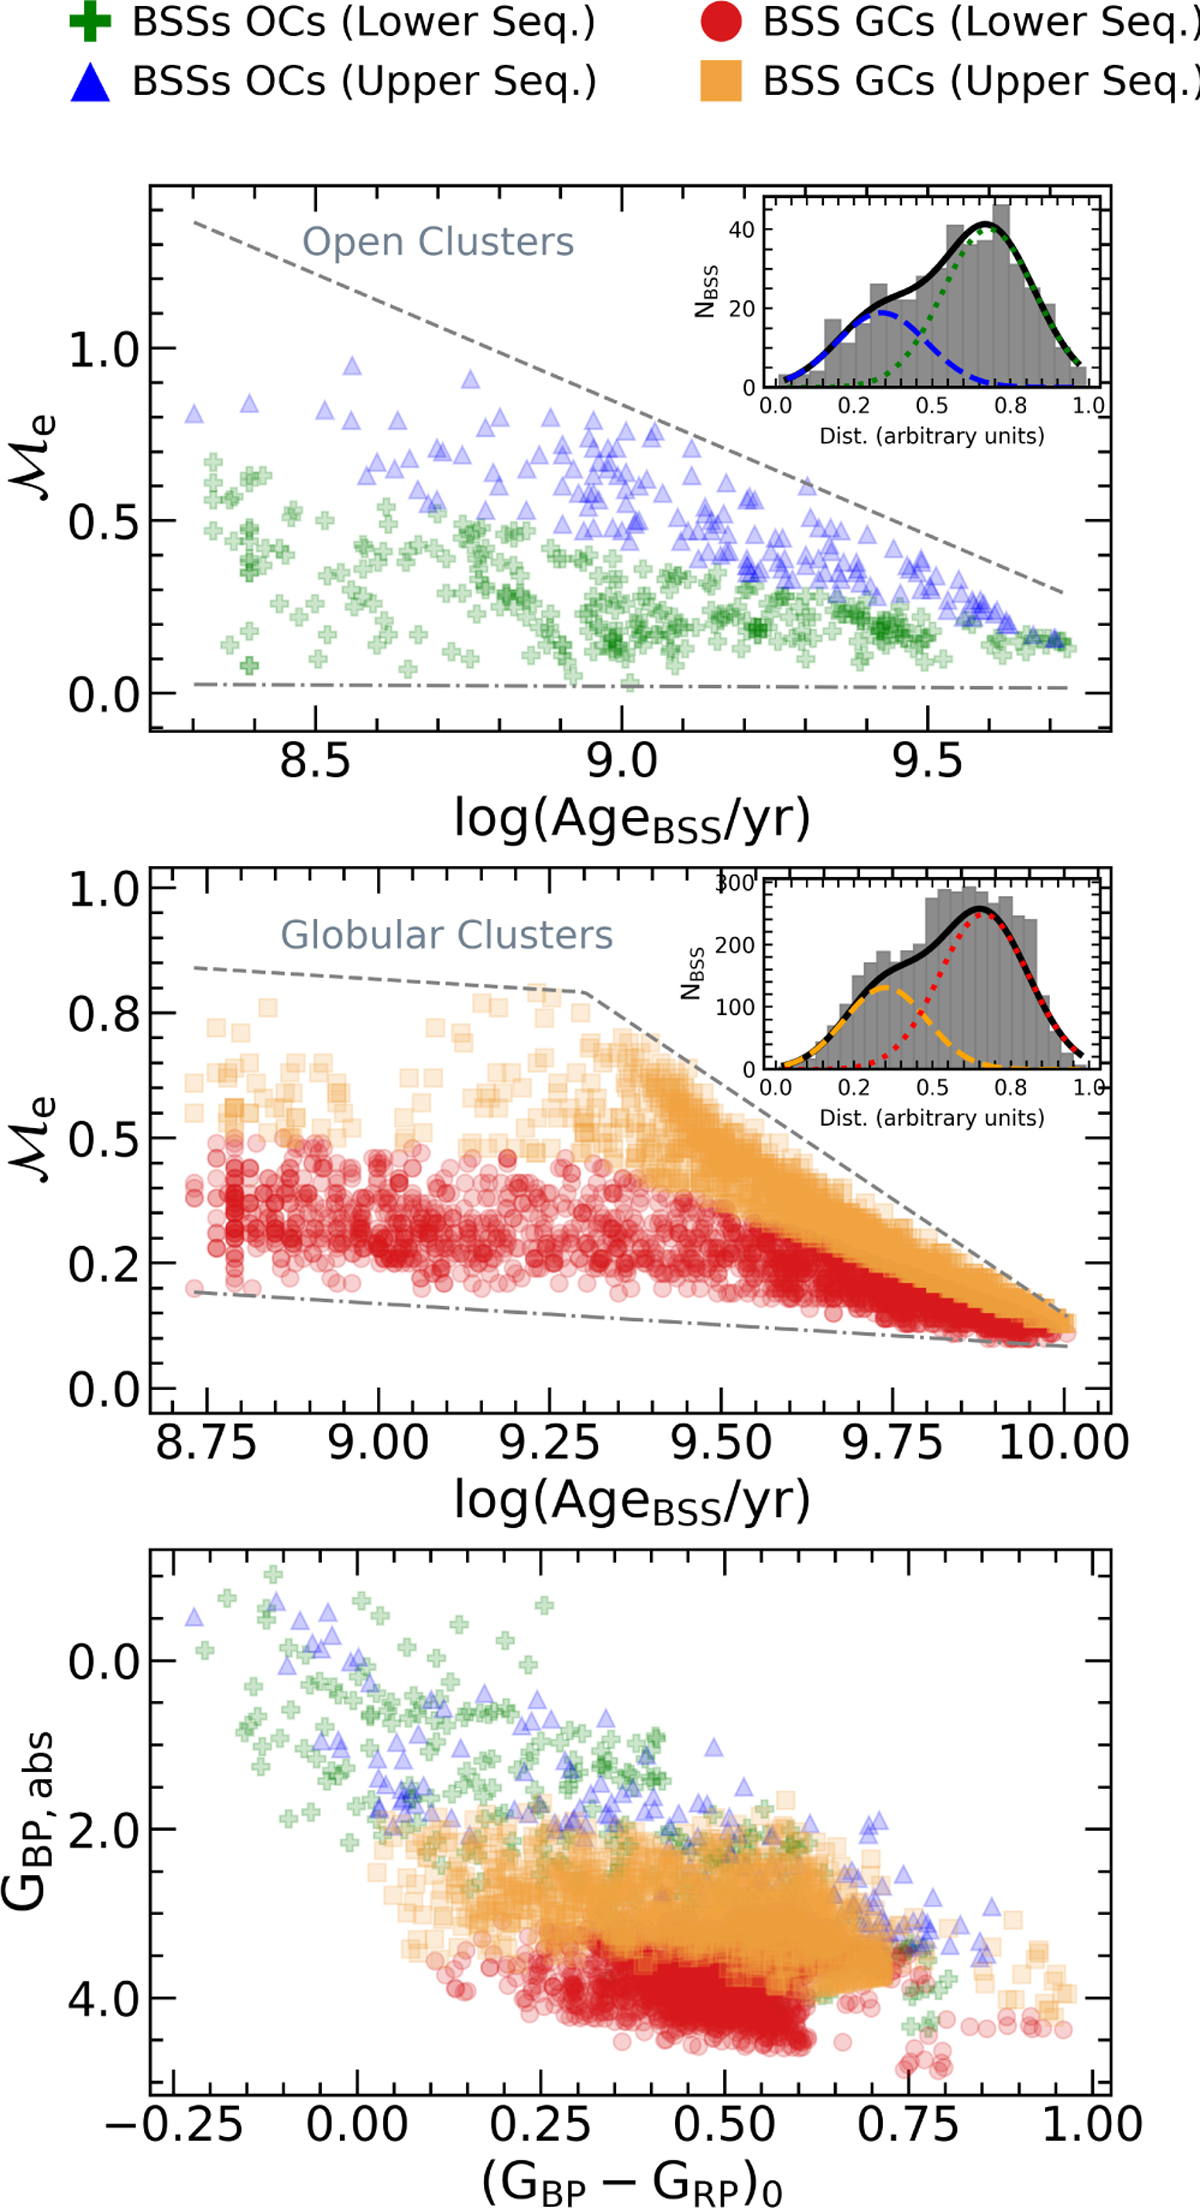
Top: ![]() vs. BSS age (found with isochrone models) for OCs. Middle:
vs. BSS age (found with isochrone models) for OCs. Middle: ![]() vs. BSS age (found with isochrone models) for GCs. In both Top and Middle panels, the dashed gray lines used to separate the BSSs classified as “upper” or “lower” sequences. OC BSSs and GC BSS that are tagged as “upper” sequence BSSs are symbolized by blue triangles and yellow squares, respectively. “lower” sequence for OCs and GCs are represented by green plus (+) symbols and red dots, respectively. Bottom: CMD (using absolute magnitudes and de-reddened colors) based on BSSs sequence tag. Symbols are the same as the top figure.
vs. BSS age (found with isochrone models) for GCs. In both Top and Middle panels, the dashed gray lines used to separate the BSSs classified as “upper” or “lower” sequences. OC BSSs and GC BSS that are tagged as “upper” sequence BSSs are symbolized by blue triangles and yellow squares, respectively. “lower” sequence for OCs and GCs are represented by green plus (+) symbols and red dots, respectively. Bottom: CMD (using absolute magnitudes and de-reddened colors) based on BSSs sequence tag. Symbols are the same as the top figure.
Current usage metrics show cumulative count of Article Views (full-text article views including HTML views, PDF and ePub downloads, according to the available data) and Abstracts Views on Vision4Press platform.
Data correspond to usage on the plateform after 2015. The current usage metrics is available 48-96 hours after online publication and is updated daily on week days.
Initial download of the metrics may take a while.