Fig. 8
Download original image
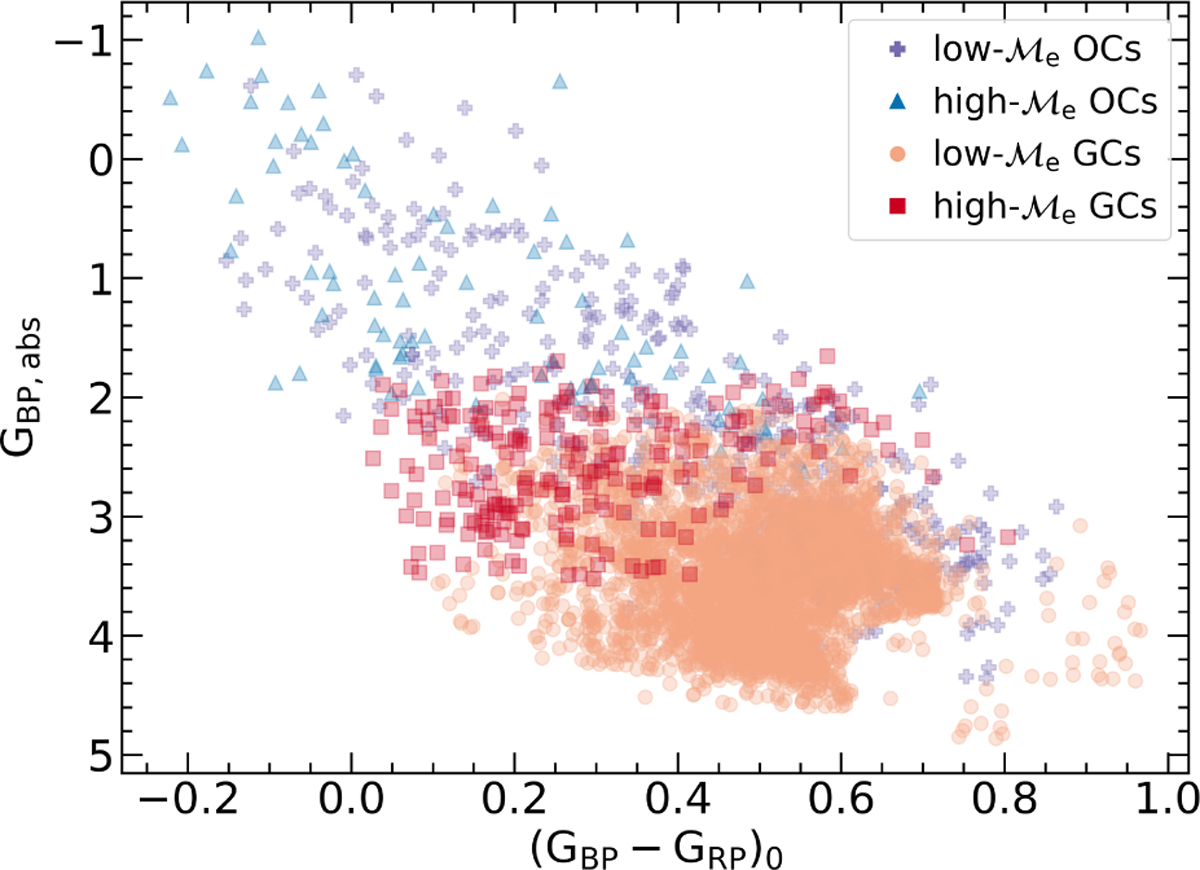
Gaia photometry color-magnitude diagram for BSSs classified by their ![]() based on the JS21 classification. Note that axes show the absolute magnitude for GBP and the de-reddened color (GBP−GRP)0. Low −
based on the JS21 classification. Note that axes show the absolute magnitude for GBP and the de-reddened color (GBP−GRP)0. Low −![]() BSSs for OCs and GCs are represented by purple plus (+) symbol and orange dots, respectively. High-
BSSs for OCs and GCs are represented by purple plus (+) symbol and orange dots, respectively. High- ![]() for OCs and GCs are represented by blue triangles and red squares, respectively.
for OCs and GCs are represented by blue triangles and red squares, respectively.
Current usage metrics show cumulative count of Article Views (full-text article views including HTML views, PDF and ePub downloads, according to the available data) and Abstracts Views on Vision4Press platform.
Data correspond to usage on the plateform after 2015. The current usage metrics is available 48-96 hours after online publication and is updated daily on week days.
Initial download of the metrics may take a while.