Fig. 7
Download original image
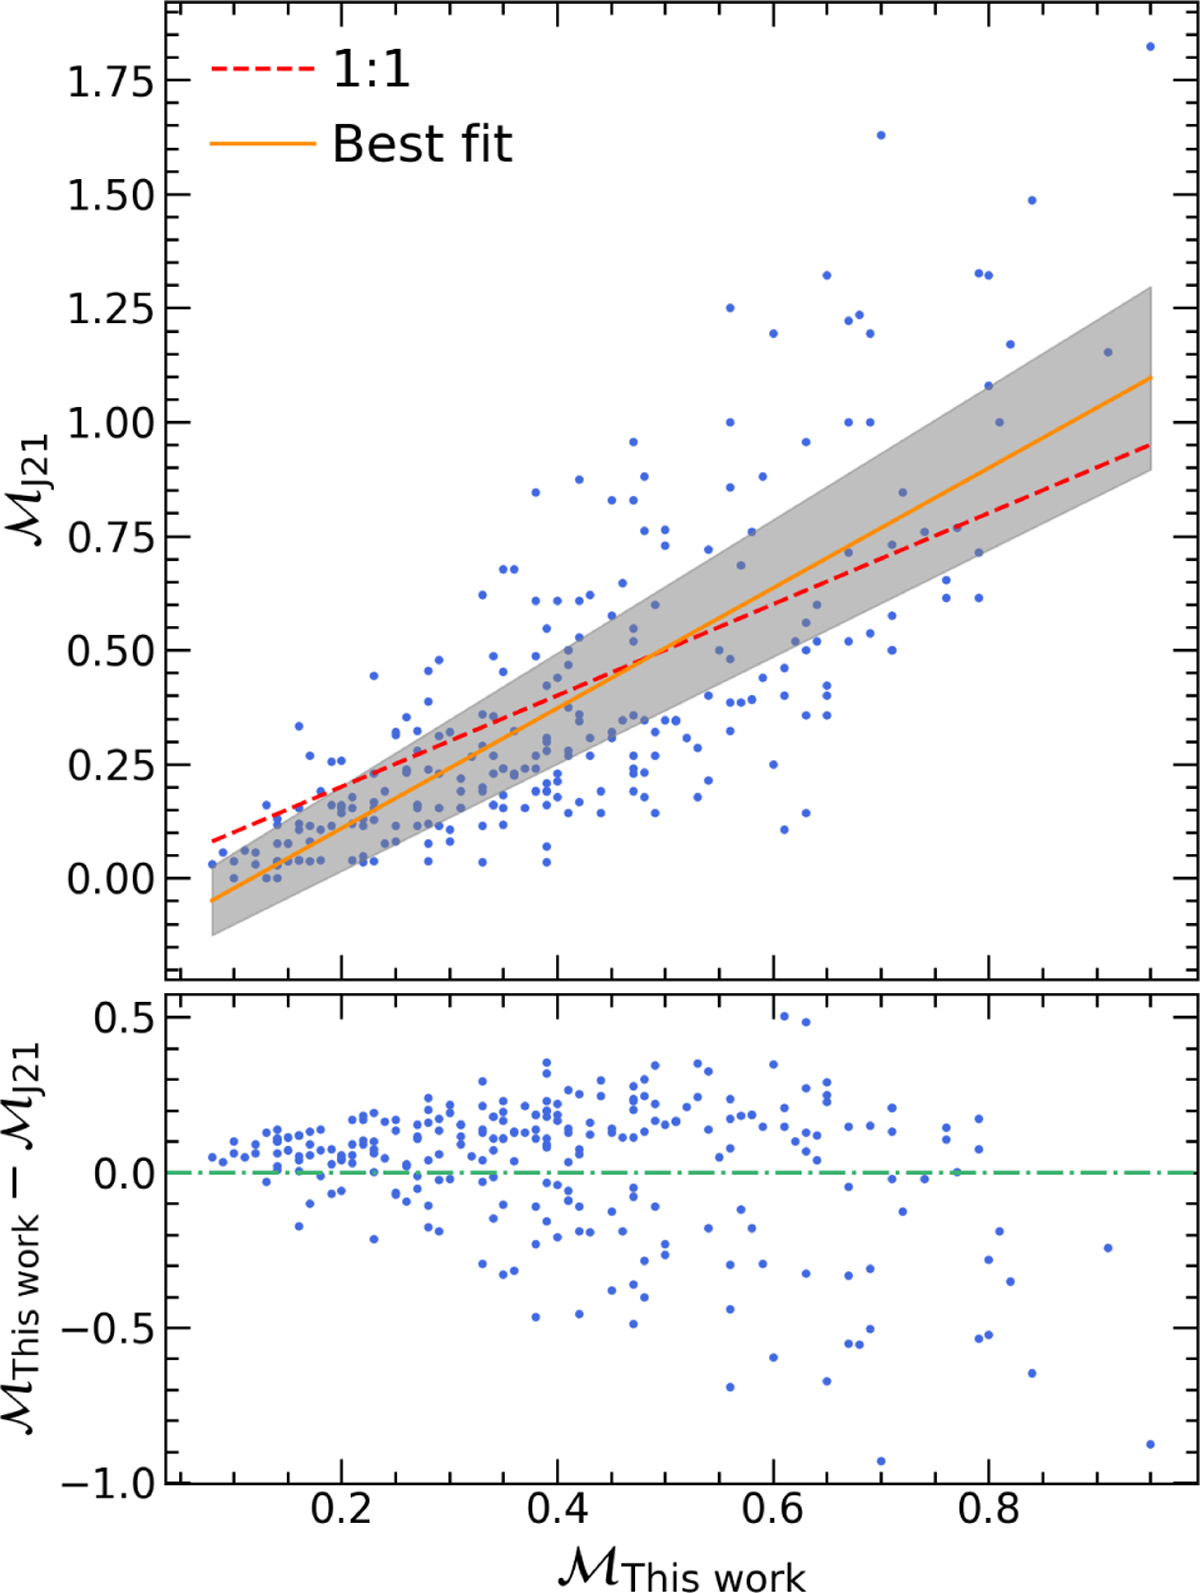
Comparison for ![]() obtained values between JS21 and this work. Top:
obtained values between JS21 and this work. Top: ![]() values from JS21 and our work. 1-to-1 line is shown as a dashed red line and best fit is shown as a solid yellow line. Shaded are shows the 95% confidence interval for the fit. Bottom: difference between JS21
values from JS21 and our work. 1-to-1 line is shown as a dashed red line and best fit is shown as a solid yellow line. Shaded are shows the 95% confidence interval for the fit. Bottom: difference between JS21 ![]() obtained values vs.
obtained values vs. ![]() found in our work. Green dot-dashed horizontal line denotes
found in our work. Green dot-dashed horizontal line denotes ![]() .
.
Current usage metrics show cumulative count of Article Views (full-text article views including HTML views, PDF and ePub downloads, according to the available data) and Abstracts Views on Vision4Press platform.
Data correspond to usage on the plateform after 2015. The current usage metrics is available 48-96 hours after online publication and is updated daily on week days.
Initial download of the metrics may take a while.