Open Access
Fig. 6
Download original image
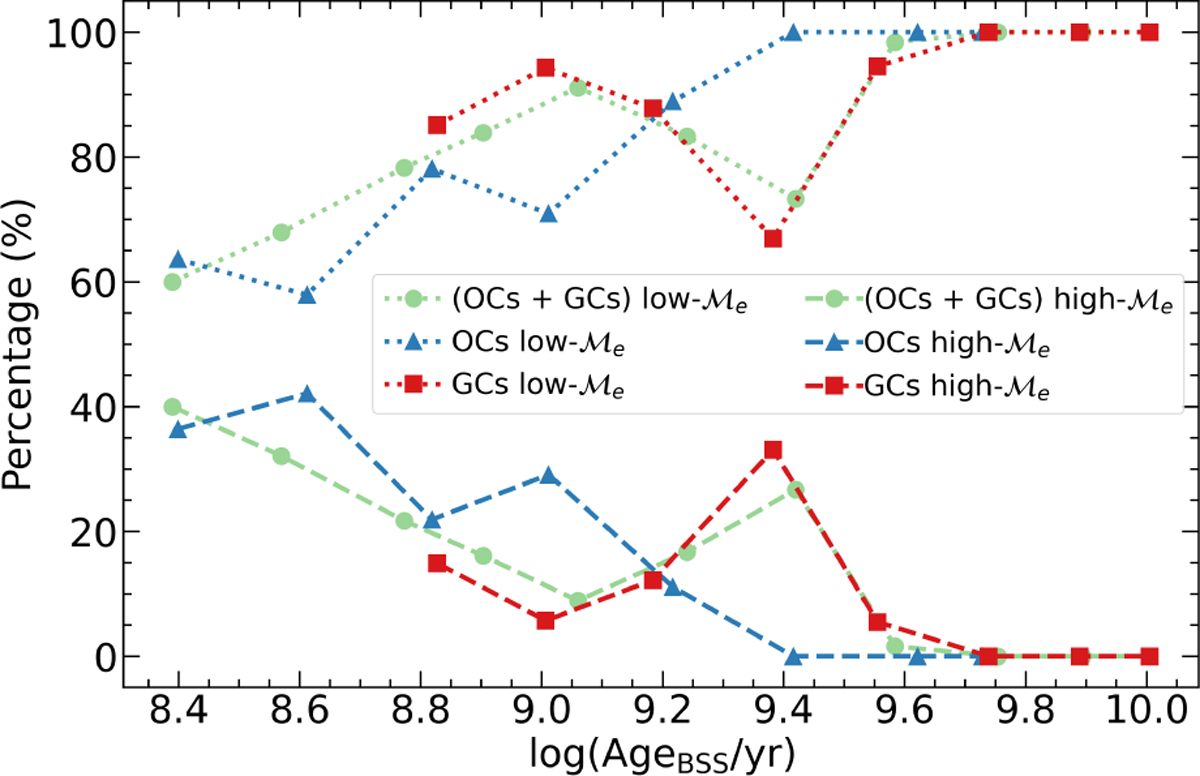
![]() percentage vs. BSSs age (found from isochrone models). All (OCs + GCs) BSSs are symbolized as green circles, GC BSSs are represented as red squares and OC BSSs as blue triangles. The line connecting the symbols indicates the
percentage vs. BSSs age (found from isochrone models). All (OCs + GCs) BSSs are symbolized as green circles, GC BSSs are represented as red squares and OC BSSs as blue triangles. The line connecting the symbols indicates the ![]() regime: dashed lines indicates high −
regime: dashed lines indicates high −![]() and dotted lines indicate low-
and dotted lines indicate low- ![]() .
.
Current usage metrics show cumulative count of Article Views (full-text article views including HTML views, PDF and ePub downloads, according to the available data) and Abstracts Views on Vision4Press platform.
Data correspond to usage on the plateform after 2015. The current usage metrics is available 48-96 hours after online publication and is updated daily on week days.
Initial download of the metrics may take a while.