Fig. 5
Download original image
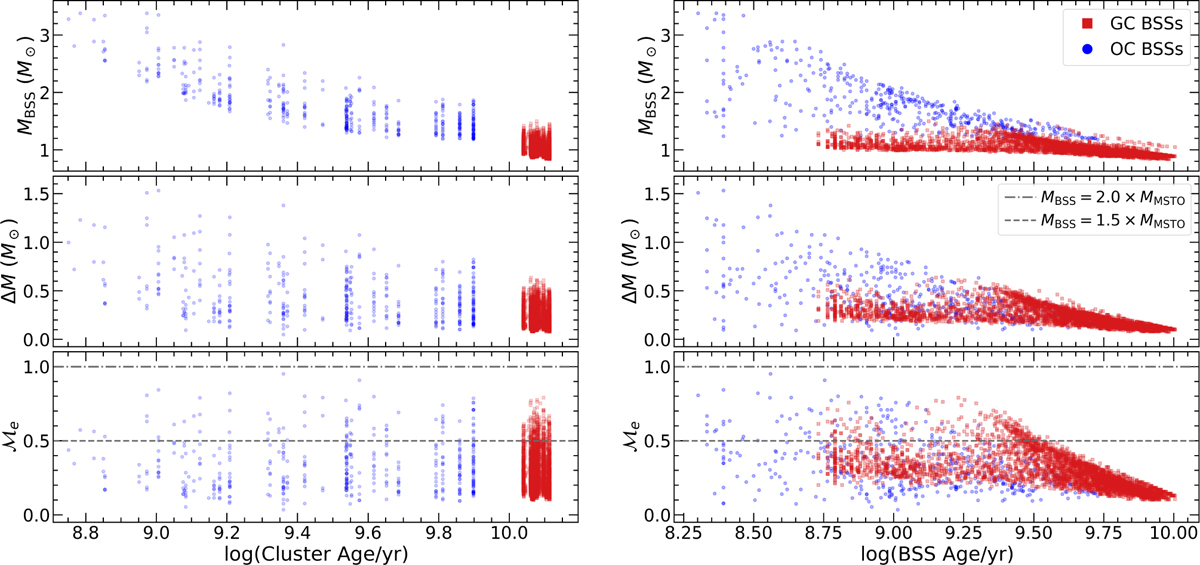
Mass of BSSs. Left: mass of BSSs (found with isochrone models) vs. parent cluster age. Upper panel shows the mass of the BSSs, the middle panel shows the difference between the BSS mass and the MSTO mass, and the lower panel shows the mass excess factor, ![]() − defined by JS21 as the difference between the BSS Mass and the MSTO Mass, normalized by the MSTO mass -, with respect to the parent cluster age. GC BSSs and OC BSSs are represented by red and blue points, respectively. We additionally draw two horizontal gray lines at the lower panel; dot-dashed gray horizontal line denotes the limit for MBSS=2.0 × MMSTO, whereas dashed gray horizontal lines denote MBSS=1.5 × MMSTO. Focusing on the lower panel and following JS21 classification, all stars between both horizontal lines are classified as high −
− defined by JS21 as the difference between the BSS Mass and the MSTO Mass, normalized by the MSTO mass -, with respect to the parent cluster age. GC BSSs and OC BSSs are represented by red and blue points, respectively. We additionally draw two horizontal gray lines at the lower panel; dot-dashed gray horizontal line denotes the limit for MBSS=2.0 × MMSTO, whereas dashed gray horizontal lines denote MBSS=1.5 × MMSTO. Focusing on the lower panel and following JS21 classification, all stars between both horizontal lines are classified as high −![]() (most likely formed via collisions/mergers), and all stars under the horizontal dashed gray line are classified as low −
(most likely formed via collisions/mergers), and all stars under the horizontal dashed gray line are classified as low −![]() (most likely formed via MT). Right: same as the left side of the figure, but displaying Mass of BSSs vs. BSSs age (found with isochrone models).
(most likely formed via MT). Right: same as the left side of the figure, but displaying Mass of BSSs vs. BSSs age (found with isochrone models).
Current usage metrics show cumulative count of Article Views (full-text article views including HTML views, PDF and ePub downloads, according to the available data) and Abstracts Views on Vision4Press platform.
Data correspond to usage on the plateform after 2015. The current usage metrics is available 48-96 hours after online publication and is updated daily on week days.
Initial download of the metrics may take a while.