Fig. 4
Download original image
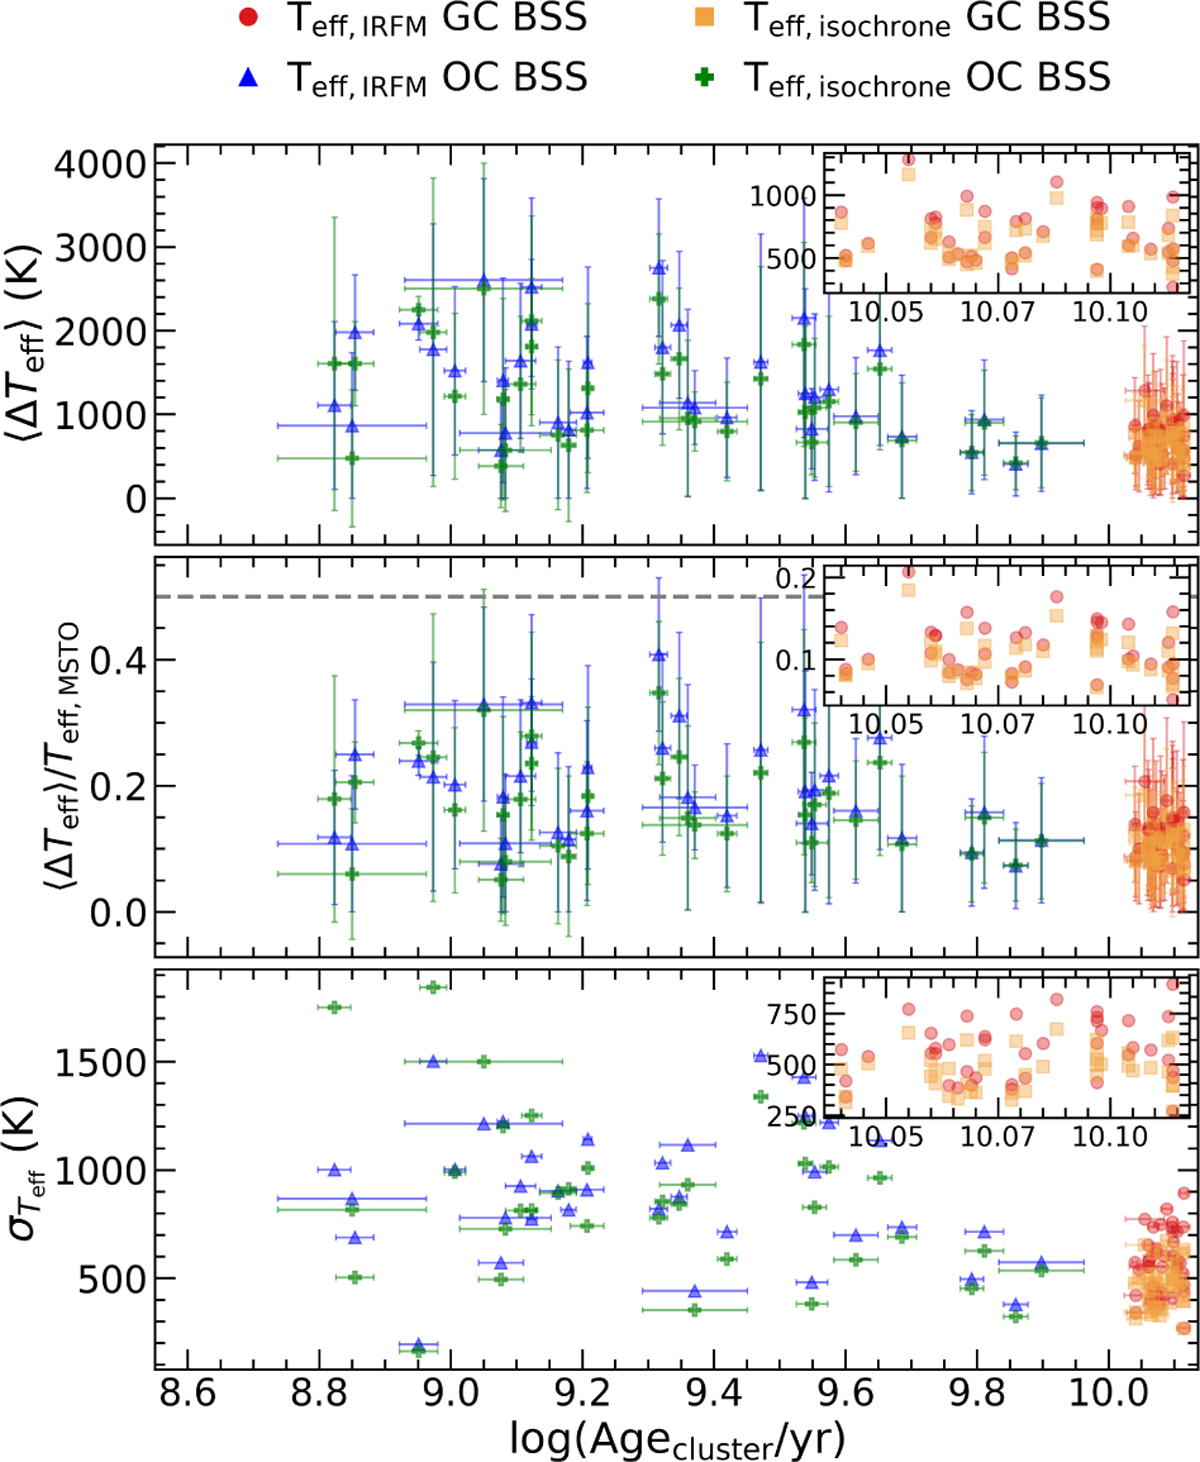
Teff vs. cluster age. Top: ⟨ Teff⟩ – the mean of the difference between BSS Teff and MSTO Teff, found with the same method, for stars within the same cluster – vs. cluster age. Blue triangles and red dots represent Teff obtained from color-temperature relations for OCs and GCs, respectively. Green plus symbols (+) and orange squares represent Teff derived from isochrone models for OCs and GCs, respectively. At the top right corner we show the results only for GCs without error bars for a better appreciation, keeping the same axes from the major plot. Error bars along vertical axis show the dispersion of BSSs Teff. Middle: difference between ⟨ Teff⟩ and the MSTO Teff, normalized by the MSTO temperature. Horizontal gray dashed line indicates BSS Teff=1.5 × MSTO Teff. Bottom: dispersion of BSS Teff vs. cluster age.
Current usage metrics show cumulative count of Article Views (full-text article views including HTML views, PDF and ePub downloads, according to the available data) and Abstracts Views on Vision4Press platform.
Data correspond to usage on the plateform after 2015. The current usage metrics is available 48-96 hours after online publication and is updated daily on week days.
Initial download of the metrics may take a while.