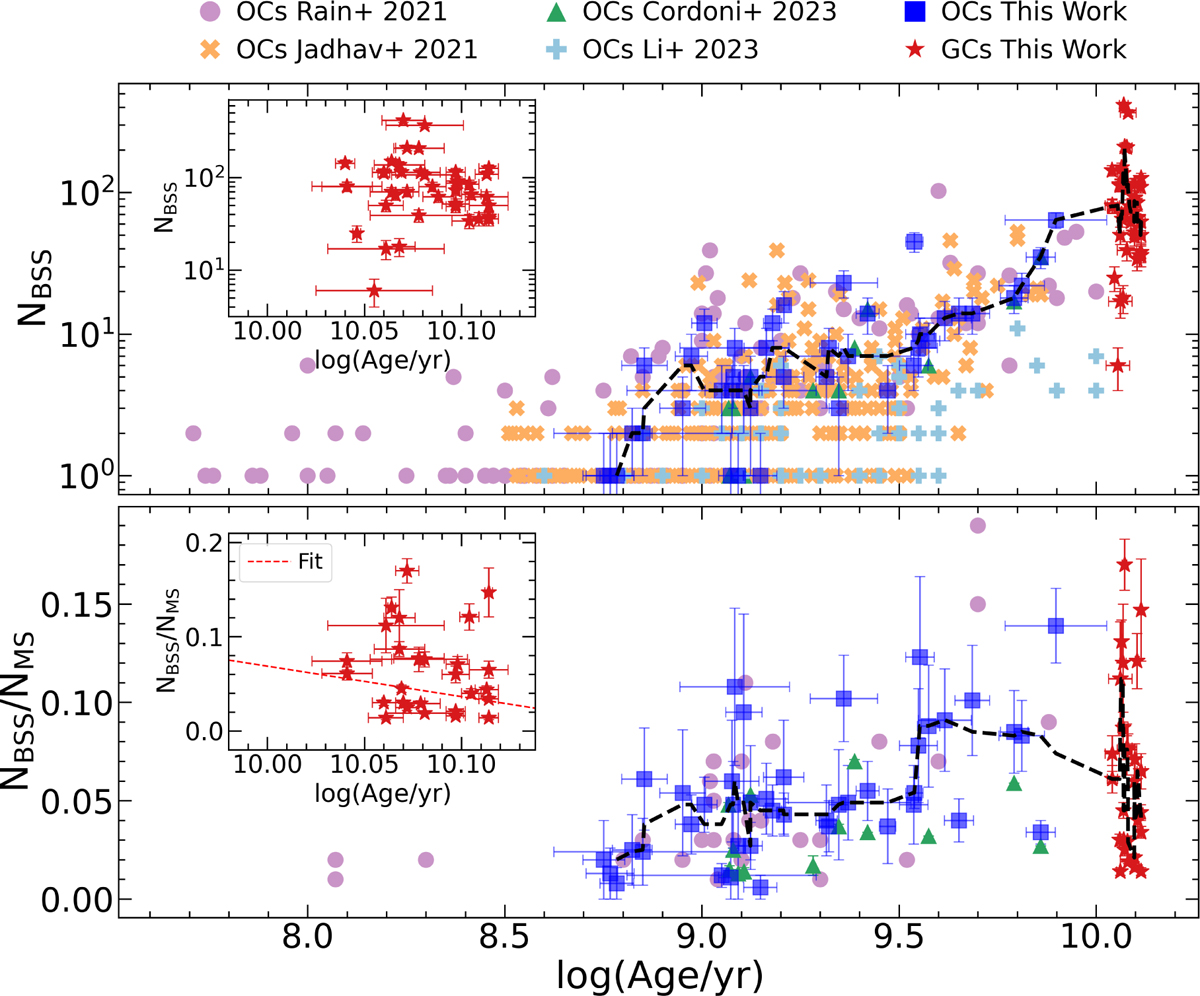
Fig. 3
Download original image
Top panel: absolute number of BSSs vs. age of parent cluster found in this work and other Gaia-based studies. Uncertainties in the BSS number are assumed as Poisson errors. The inset sub-panel shows a zoom-in on the GC age range for better visualization. The dashed black line denotes the “ridge-line” based on the sliding histogram (see text for details). Bottom panel: ratio of BSS numbers relative to the number of MS stars in the luminosity range between MSTO and MSTO+1 mag (see Sect. 3.1). We compare the ratio against those studies that also provide this parameter with the same criteria for MS stars number selection, if available. From the considered studies (see legend), only R21 and Cordoni et al. (2023) have this parameter available. Data based in our work is plotted only for those GCs whose NMS is not cut by the photometric depth selection described in Section 2.1; this is done to guarantee a consistent comparison between different clusters and samples. For the uncertainty in NBSS/NMS we assume a simple error propagation with Poisson errors for MS stars and BSSs. Errors in age for GCs are based on the difference between our best-fitting isochrone models and those derived from Baumgardt et al. (2023), whereas errors in ages for OCs are taken from Dias et al. (2021). Similar to the top figure, the black-dashed line represents the “ridge-line” based on the sliding histogram.
Current usage metrics show cumulative count of Article Views (full-text article views including HTML views, PDF and ePub downloads, according to the available data) and Abstracts Views on Vision4Press platform.
Data correspond to usage on the plateform after 2015. The current usage metrics is available 48-96 hours after online publication and is updated daily on week days.
Initial download of the metrics may take a while.