Fig. 2
Download original image
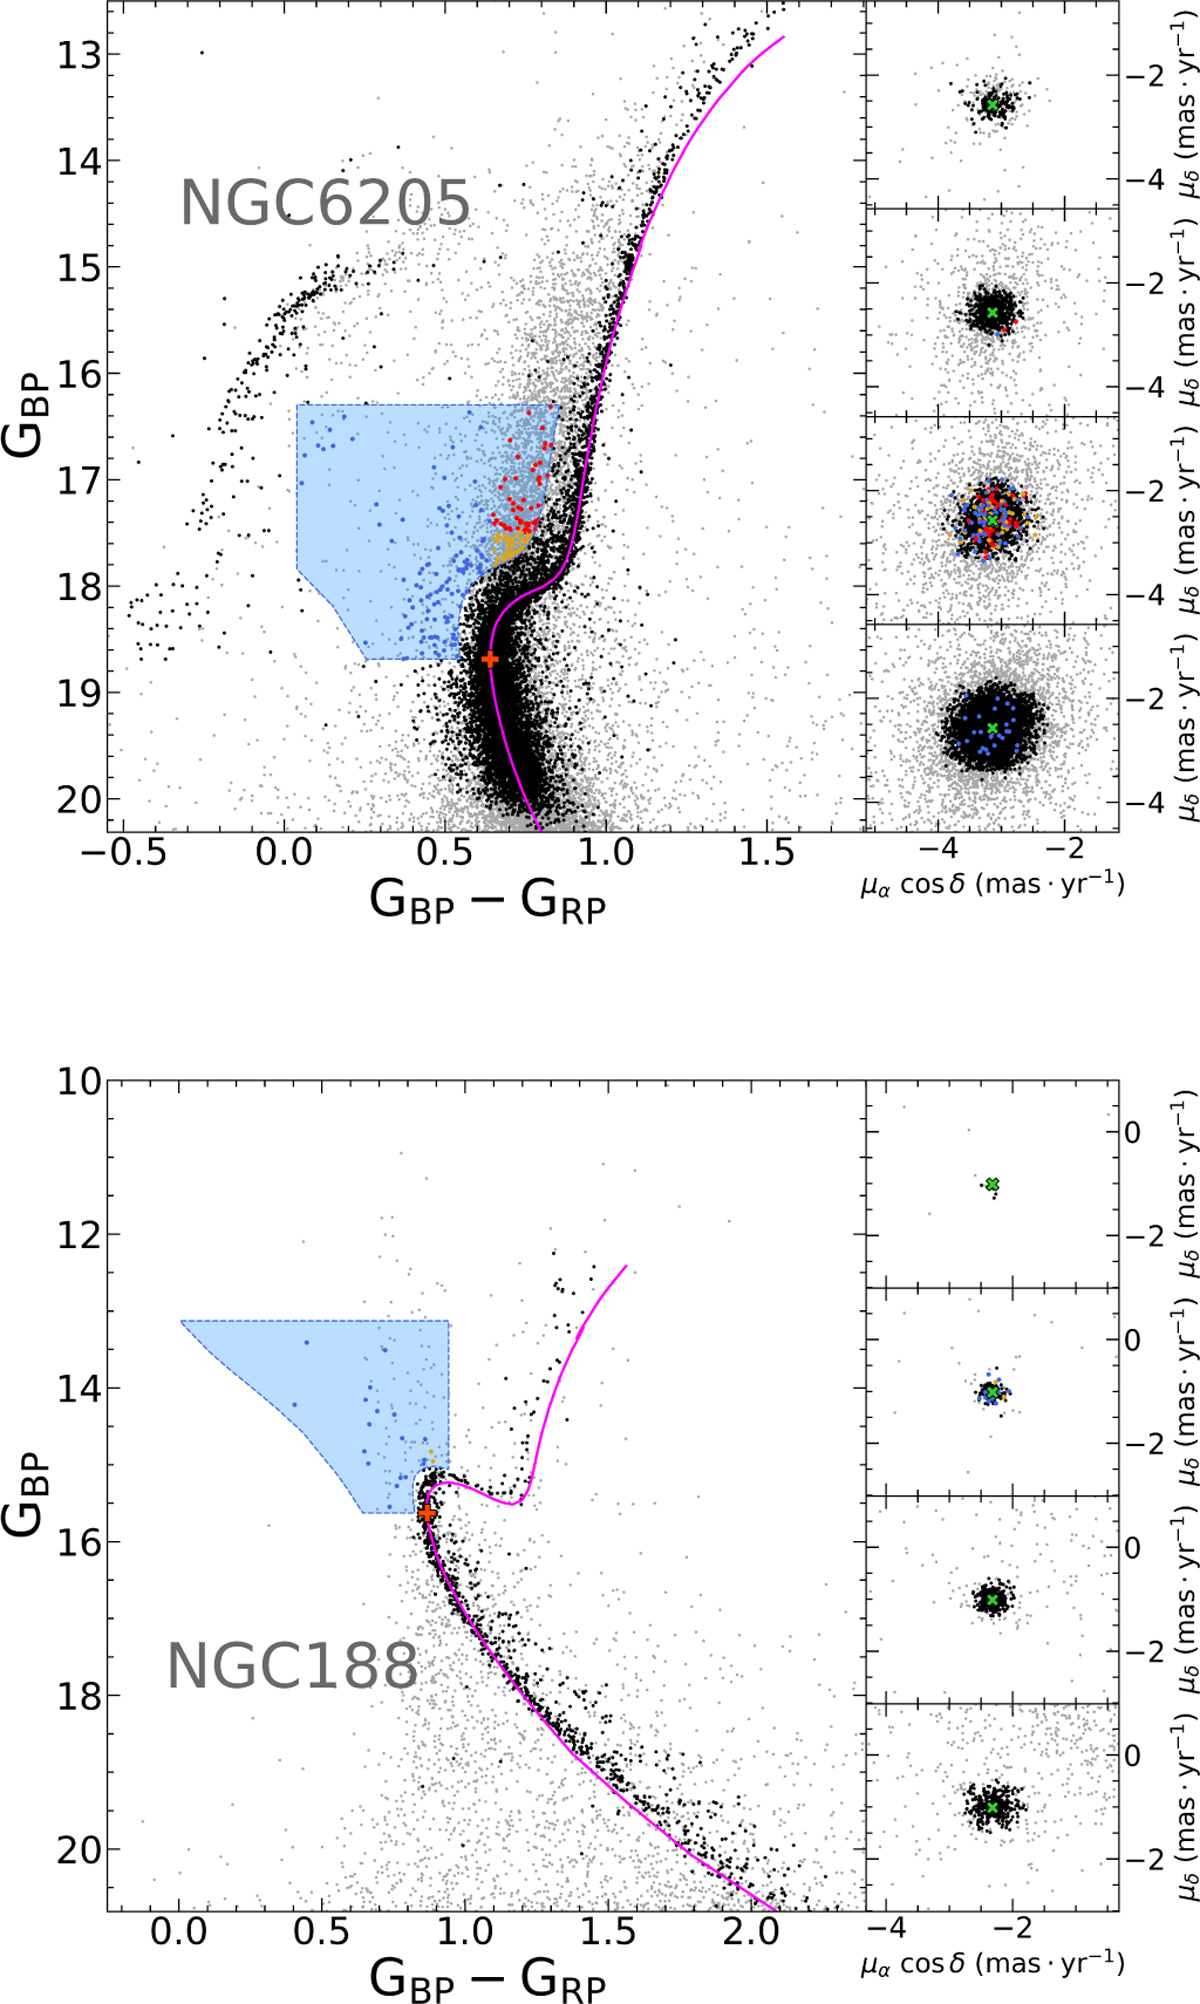
Top: CMD of the GC NGC 6205 using Gaia DR3. Stars that were discarded as cluster members using our selection procedure are shown as gray dots, while cluster members are plotted as black dots. The blue shaded area represents our selection area for BSSs, YSSs and RSSs (see Sect. 2.2) which are shown as blue, yellow and red dots, respectively. The magenta solid curve represents the best-fitting PARSEC isochrone, with the + symbol indicating the MSTO. The right panels show the VPDs for the stars in the respective magnitude range from the left panel. Green crosses represent the median of confirmed members for both components in the VPD. Bottom: same as the top figure, but for the OC NGC 188. We added a red border in the selection area for OCs to avoid AGB/RGB stars (see text for details).
Current usage metrics show cumulative count of Article Views (full-text article views including HTML views, PDF and ePub downloads, according to the available data) and Abstracts Views on Vision4Press platform.
Data correspond to usage on the plateform after 2015. The current usage metrics is available 48-96 hours after online publication and is updated daily on week days.
Initial download of the metrics may take a while.