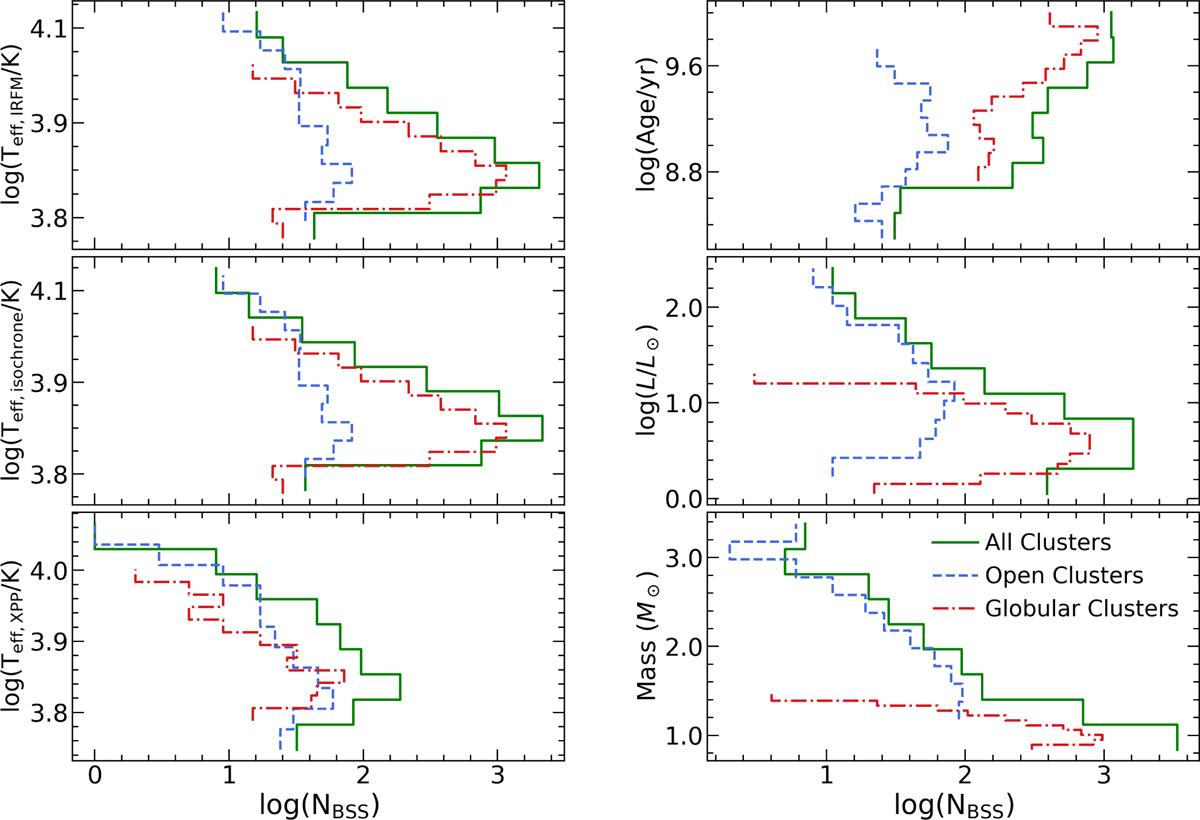
Fig. B.1
Download original image
Histogram of derived astrophysical parameters for our sample BSSs. Top, middle and bottom left panels are the distributions for effective temperatures derived from color-temperature relations, isochrone fittings, and the XPP method (from Gaia DR3 spectroscopy, if available), respectively. Top, middle and bottom right panels are the distributions obtained from isochrone fitting, for BSS ages, luminosities and masses, respectively. GCs are denoted as a red dotted-dashed line, OCs as a dashed blue line and the distribution for all clusters (GCs + OCs) is depicted as a solid green line.
Current usage metrics show cumulative count of Article Views (full-text article views including HTML views, PDF and ePub downloads, according to the available data) and Abstracts Views on Vision4Press platform.
Data correspond to usage on the plateform after 2015. The current usage metrics is available 48-96 hours after online publication and is updated daily on week days.
Initial download of the metrics may take a while.