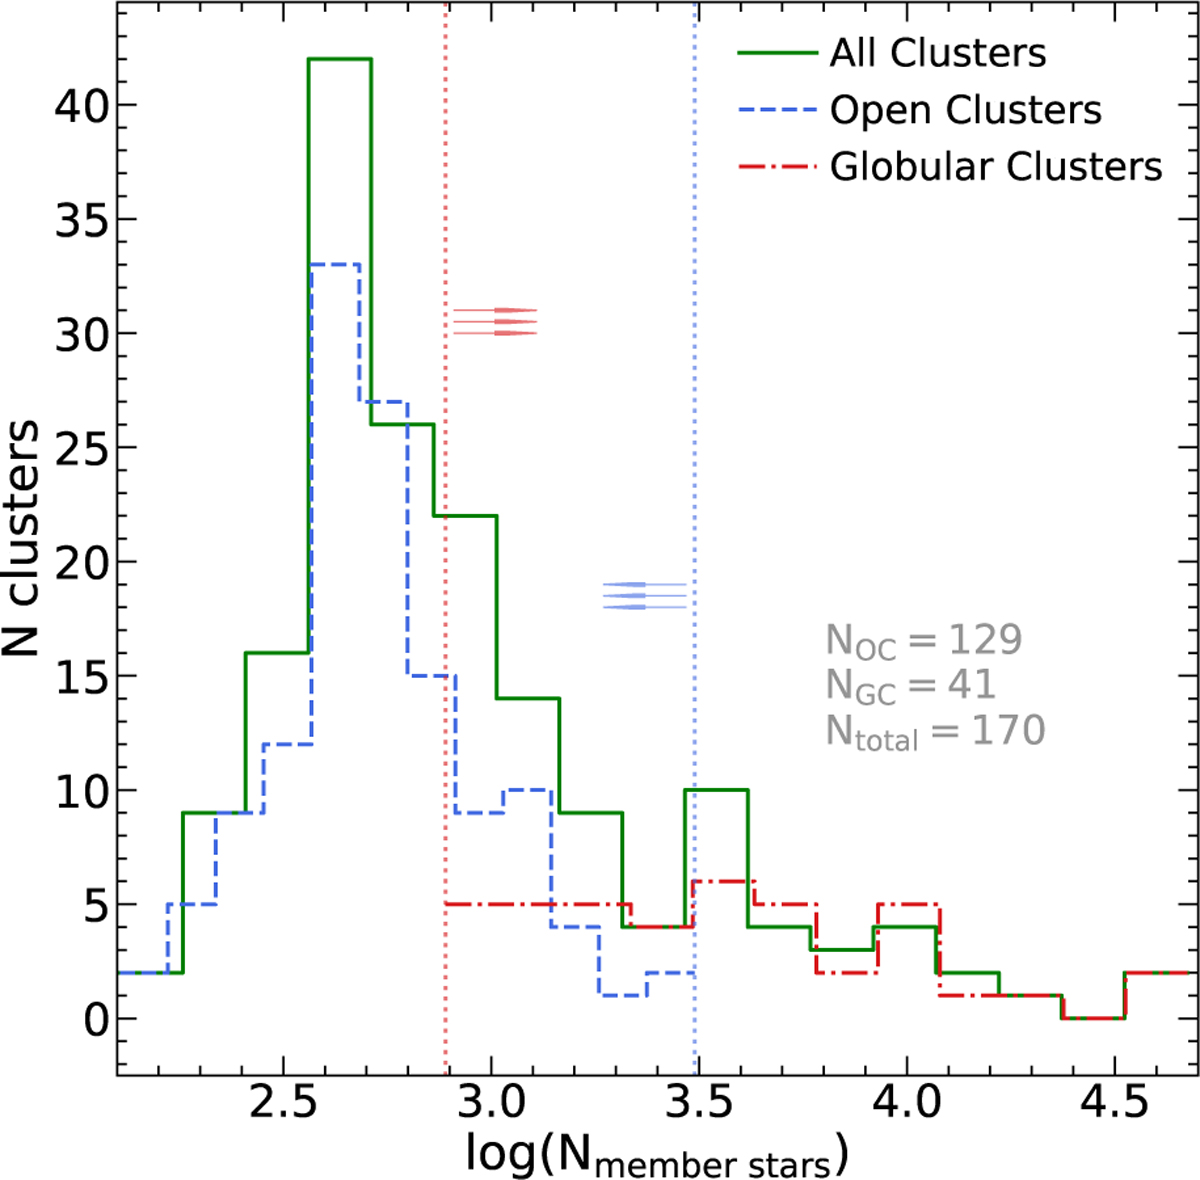
Fig. 1
Download original image
Histogram for the identified member stars in our sample GCs and OCs (see Sect. 2.1 for details). The distribution for GCs is shown as a dash-dotted red line, for OCs as a dashed blue line, and for the composite sample (GCs+OCs) as a solid green line. The dotted vertical red line with arrows pointing to the right denotes the minimum number of member stars for GCs, and the dotted vertical blue line with arrows pointing to the left indicates the maximum number of identified member stars in OCs.
Current usage metrics show cumulative count of Article Views (full-text article views including HTML views, PDF and ePub downloads, according to the available data) and Abstracts Views on Vision4Press platform.
Data correspond to usage on the plateform after 2015. The current usage metrics is available 48-96 hours after online publication and is updated daily on week days.
Initial download of the metrics may take a while.