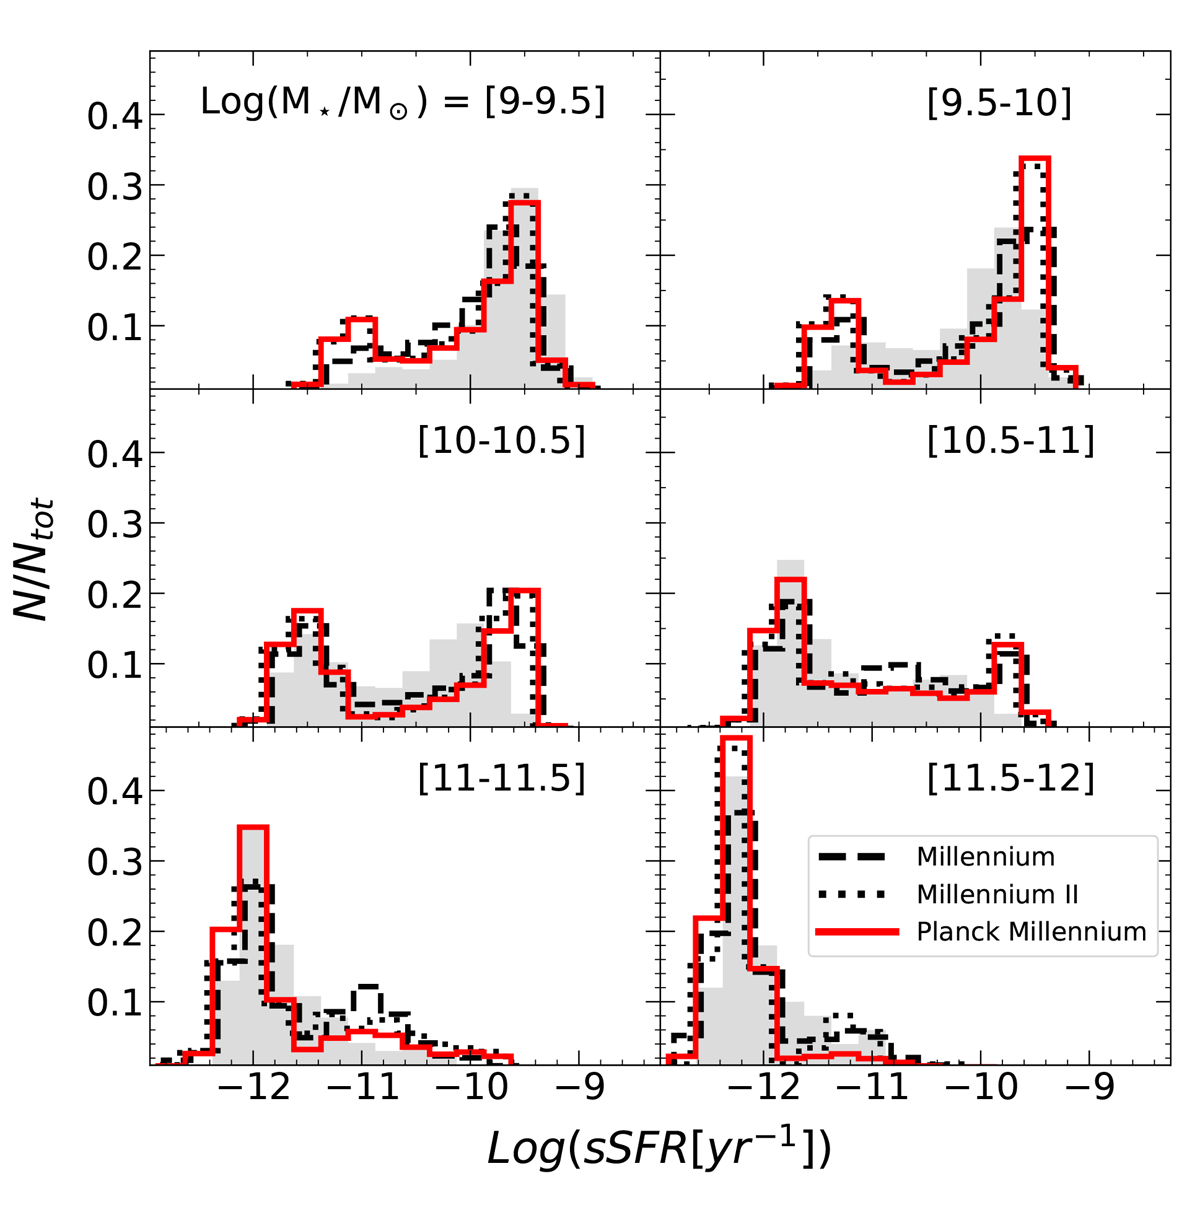
Fig. A.1.
Download original image
Specific star formation rate distribution in stellar mass bins, compared to SDSS DR8 observational estimates (grey shaded histograms). The MS and MSII histograms have been slightly shifted (by 0.05 dex) for clarity. The black solid, black dashed, and red solid lines refer the GAEA model version presented in DL24 and run on MS, MSII, and PMS, respectively.
Current usage metrics show cumulative count of Article Views (full-text article views including HTML views, PDF and ePub downloads, according to the available data) and Abstracts Views on Vision4Press platform.
Data correspond to usage on the plateform after 2015. The current usage metrics is available 48-96 hours after online publication and is updated daily on week days.
Initial download of the metrics may take a while.