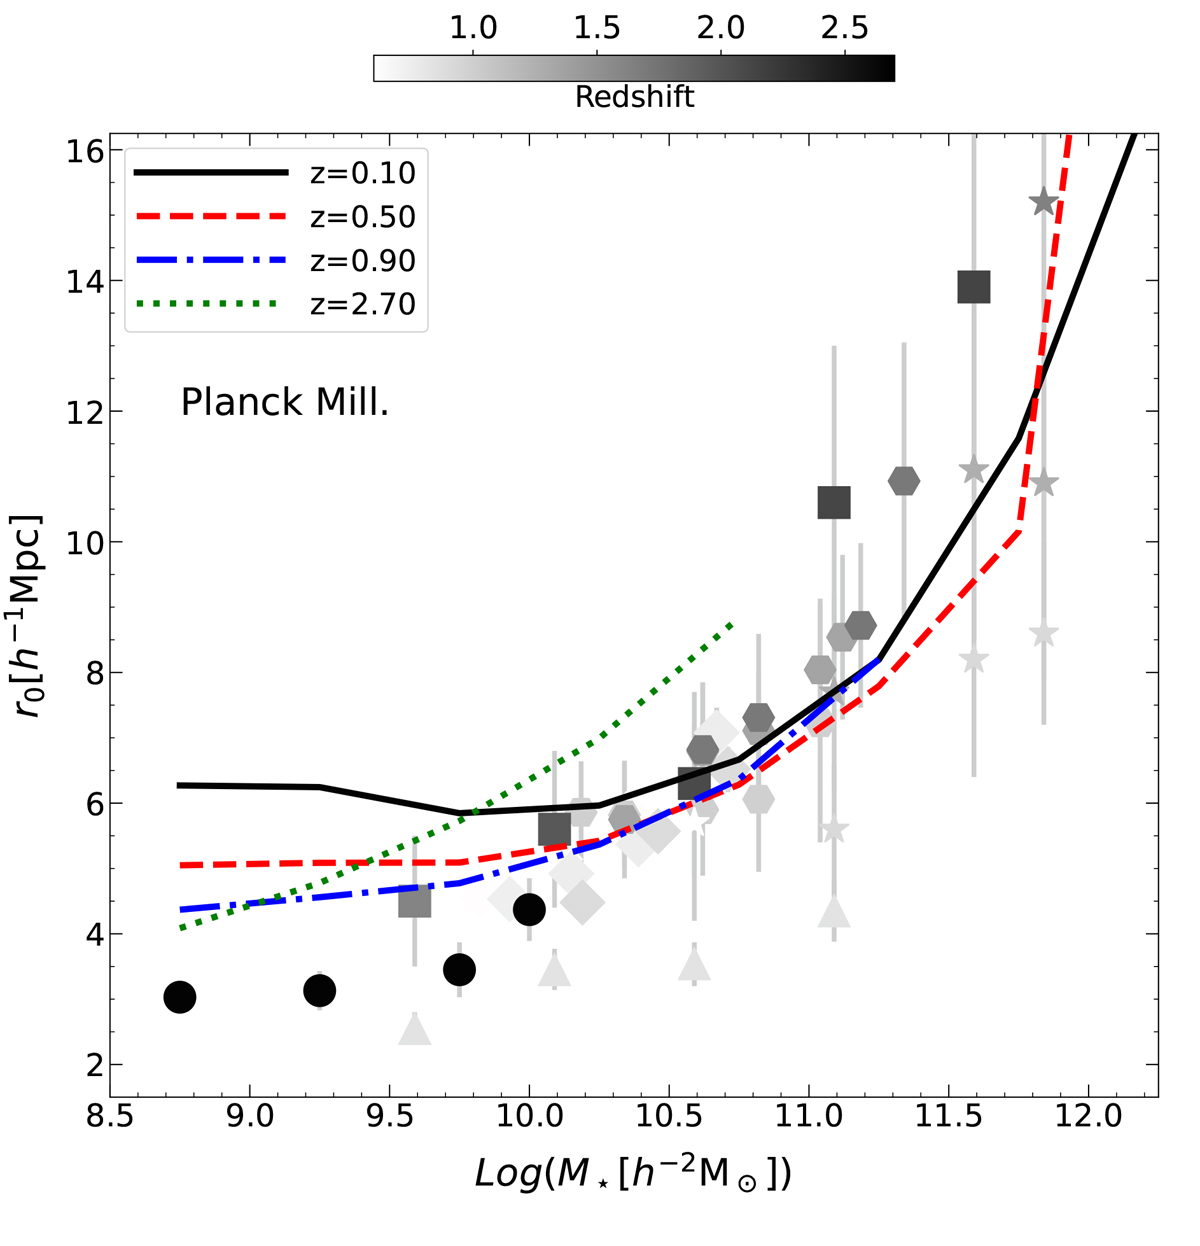
Fig. 7.
Download original image
Clustering length r0 as a function of stellar mass. The GAEA predictions for the PMS at different redshifts are marked by different colours and linetypes (see legend). The data compilation is from Meneux et al. (2008, triangles), Foucaud et al. (2010, stars), Wake et al. (2011, hexagons), Lin et al. (2012, squares), Marulli et al. (2013, diamonds), Durkalec et al. (2018, circles).
Current usage metrics show cumulative count of Article Views (full-text article views including HTML views, PDF and ePub downloads, according to the available data) and Abstracts Views on Vision4Press platform.
Data correspond to usage on the plateform after 2015. The current usage metrics is available 48-96 hours after online publication and is updated daily on week days.
Initial download of the metrics may take a while.