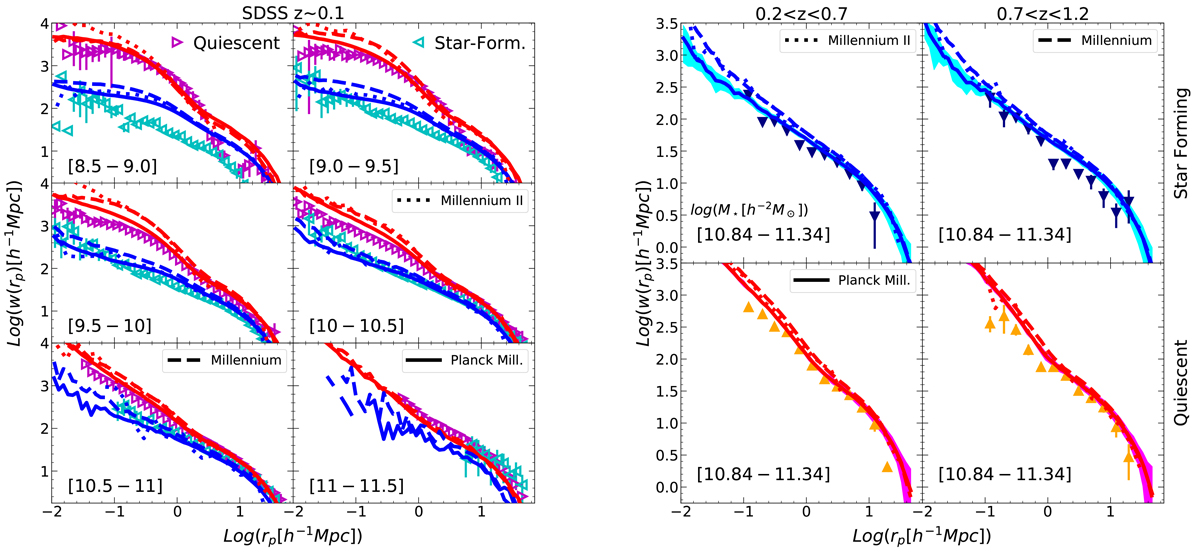
Fig. 4.
Download original image
Left: Projected two-point correlation function for red and blue galaxies at z ∼ 0.1; data from Li et al. (2006). Right: Projected two-point correlation function for star forming and quiescent galaxies; data from Coil et al. (2017). GAEA predictions refer to the realizations run on the MS (dashed lines) and on the PMS (solid lines) as in Fig. 2.
Current usage metrics show cumulative count of Article Views (full-text article views including HTML views, PDF and ePub downloads, according to the available data) and Abstracts Views on Vision4Press platform.
Data correspond to usage on the plateform after 2015. The current usage metrics is available 48-96 hours after online publication and is updated daily on week days.
Initial download of the metrics may take a while.