Fig. 8.
Download original image
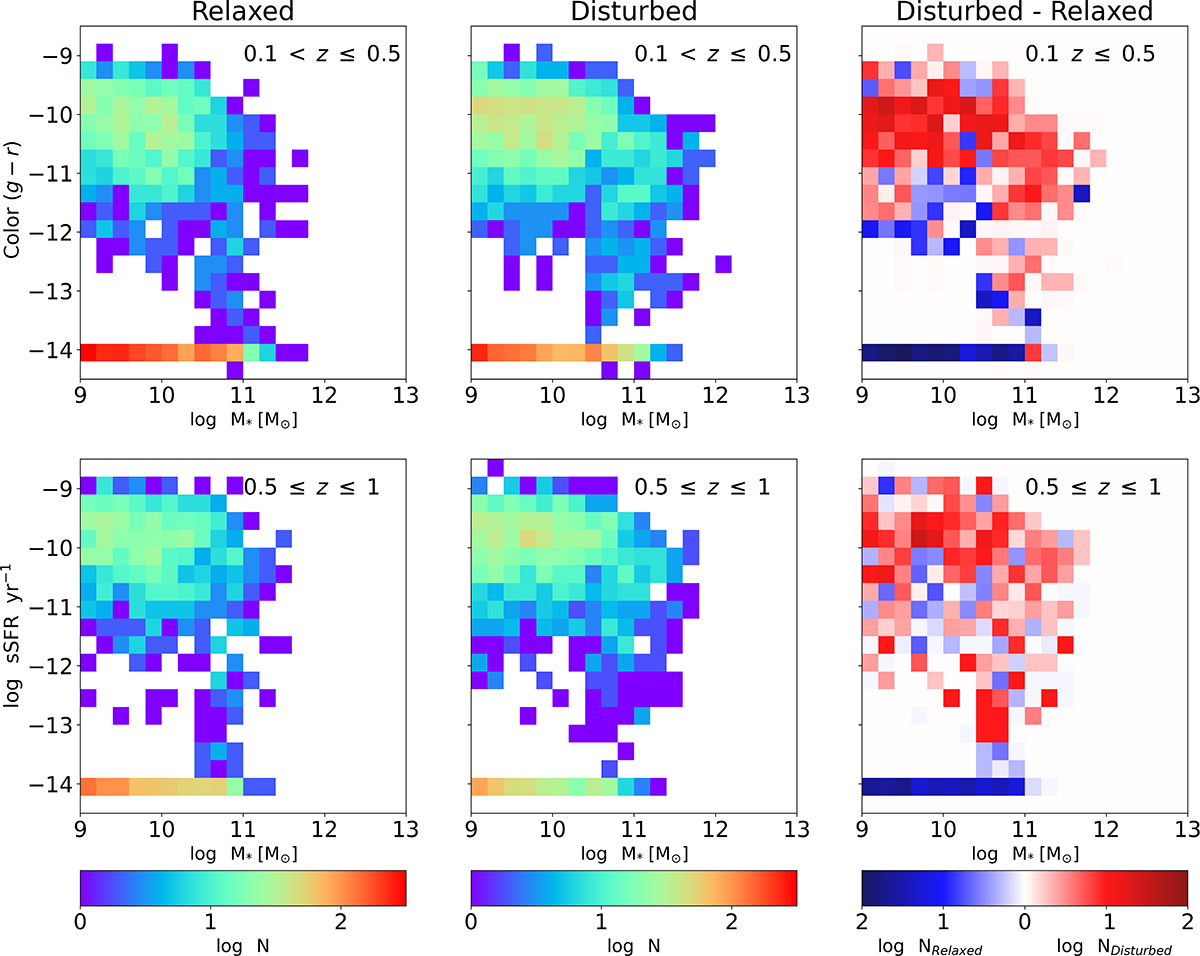
Specific star formation rate in function of stellar mass diagrams for relaxed halos in the left panels, disturbed halos in the centre panels, and the difference between relaxed and disturbed halos right panels, for the low-redshift (top) and high-redshift (bottom) bins. In the last panel, the excess of galaxies bounded to relaxed halos are shown in blue, and the zones of the diagram with an excess of galaxies bounded to disturbed halos are shown in red. There is an excess of quenched galaxies in relaxed clusters compared with the disturbed ones.
Current usage metrics show cumulative count of Article Views (full-text article views including HTML views, PDF and ePub downloads, according to the available data) and Abstracts Views on Vision4Press platform.
Data correspond to usage on the plateform after 2015. The current usage metrics is available 48-96 hours after online publication and is updated daily on week days.
Initial download of the metrics may take a while.