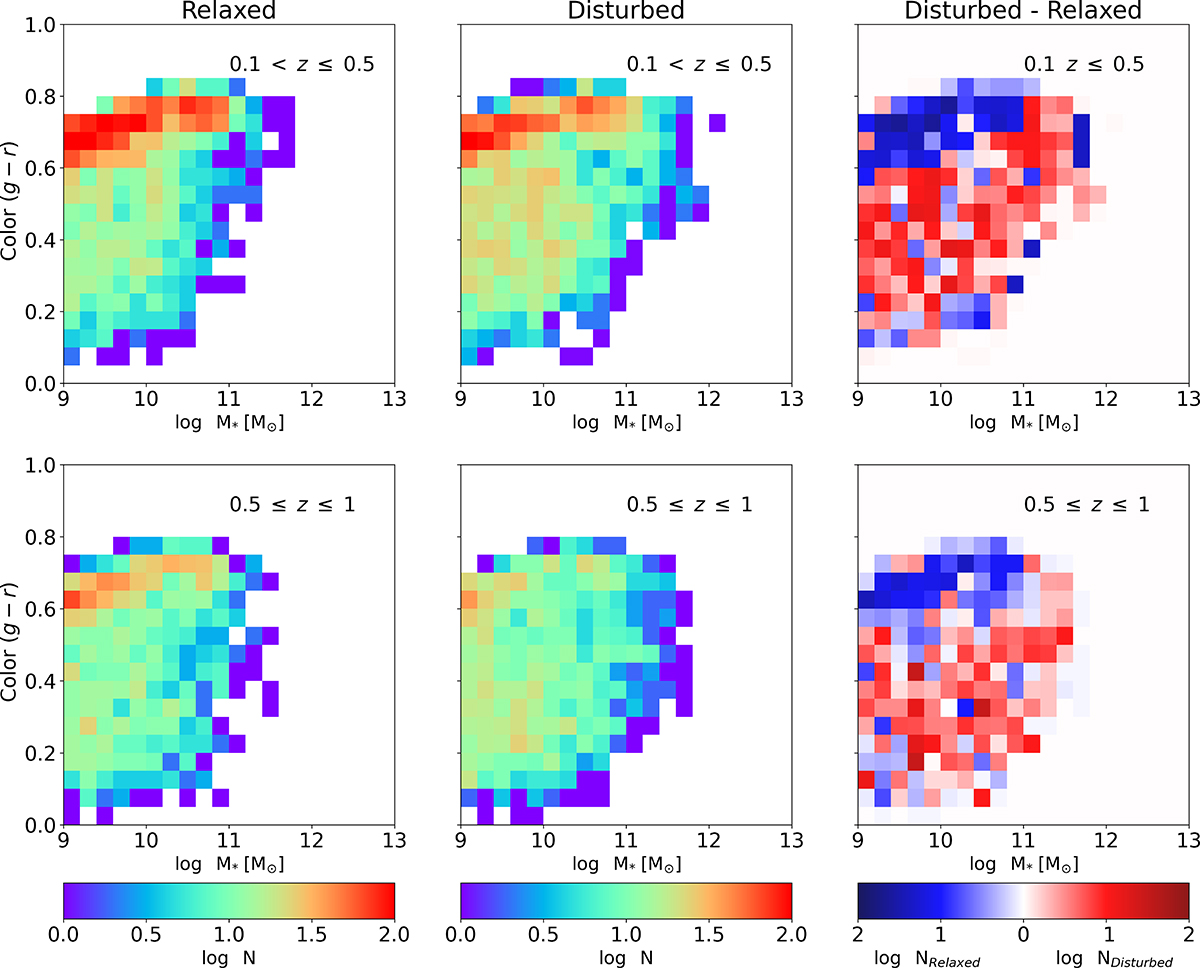
Fig. 7.
Download original image
Colour versus stellar mass diagram distribution of galaxies in relaxed in the left panel and disturbed in the middle one, for the low-redshift (top) and high-redshift (bottom) bins. In the left and middle panels we show the satellite galaxy densities distribution for the disturbed and relaxed clusters; whereas in the right panels, we have the difference in the galaxy density between relaxed and disturbed galaxy clusters after normalising. Notice that the sum of the densities in the last panel equals zero. There is an excess of galaxies in the red sequence of the diagram in relaxed clusters compared with the disturbed ones.
Current usage metrics show cumulative count of Article Views (full-text article views including HTML views, PDF and ePub downloads, according to the available data) and Abstracts Views on Vision4Press platform.
Data correspond to usage on the plateform after 2015. The current usage metrics is available 48-96 hours after online publication and is updated daily on week days.
Initial download of the metrics may take a while.