Open Access
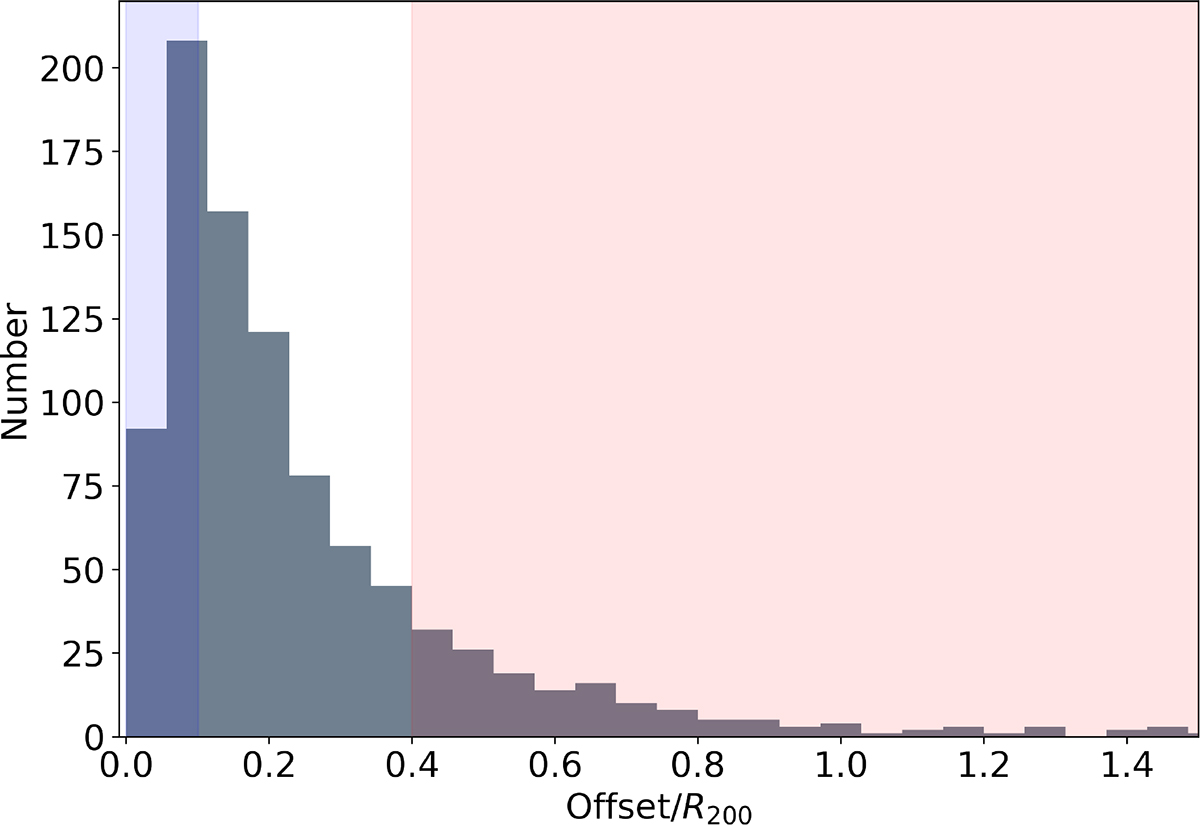
Fig. 2.
Download original image
Offset between the position of the BCG and the centre-of-mass of the gas used as an indicator of the dynamical state of groups and clusters. In the blue shadow area, the selected 153 most relaxed groups and clusters between 0.1≤z≤1, and in the red shadow area, the selected 153 disturbed ones.
Current usage metrics show cumulative count of Article Views (full-text article views including HTML views, PDF and ePub downloads, according to the available data) and Abstracts Views on Vision4Press platform.
Data correspond to usage on the plateform after 2015. The current usage metrics is available 48-96 hours after online publication and is updated daily on week days.
Initial download of the metrics may take a while.