Fig. 13.
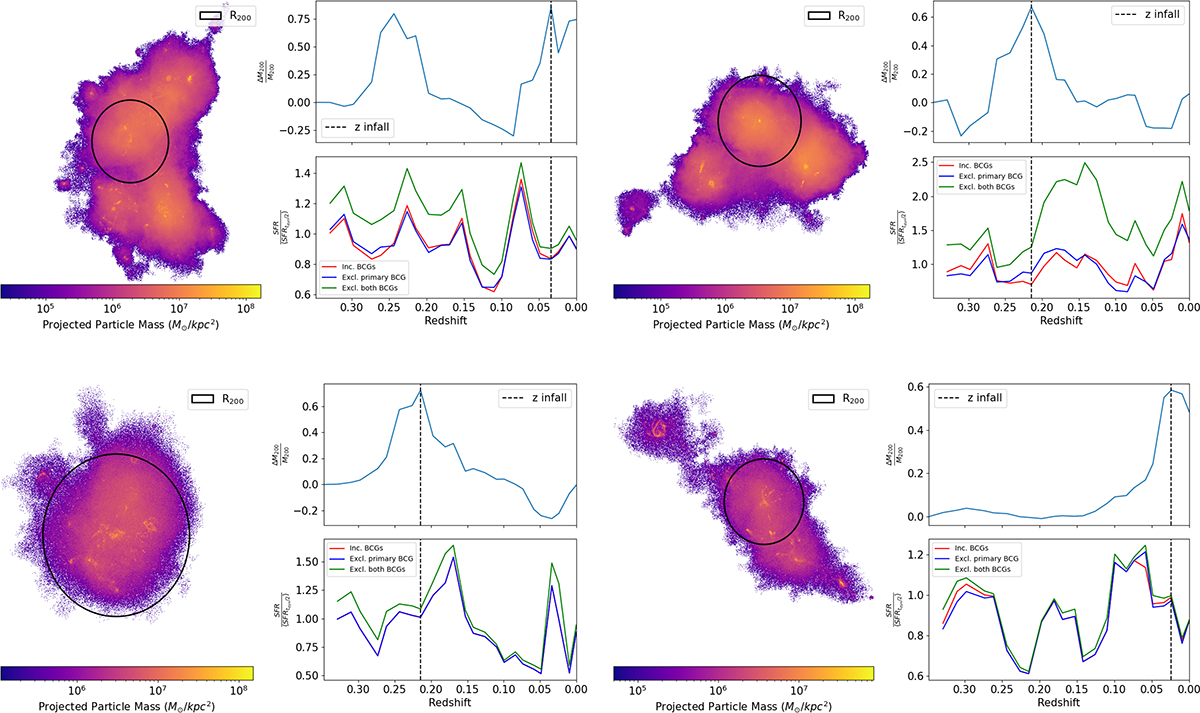
Download original image
Four selected disturbed galaxy clusters at redshift z = 0.1; the top ones are clusters in the early interacting stages, while the bottom panels show clusters in more advanced interacting stages where the secondary structure has already crossed R200 of the main one. On the left side, the projected gas mass distribution for redshift z = 0.1. On the right side, we have the temporal evolution of total virial mass M200 and the sSFR of their satellite galaxies. The clusters exhibit a short boost followed by a decrease in the sSFR, indicating that the sSFR's dynamical state may be influenced by the cluster's dynamical state.
Current usage metrics show cumulative count of Article Views (full-text article views including HTML views, PDF and ePub downloads, according to the available data) and Abstracts Views on Vision4Press platform.
Data correspond to usage on the plateform after 2015. The current usage metrics is available 48-96 hours after online publication and is updated daily on week days.
Initial download of the metrics may take a while.