Fig. 7.
Download original image
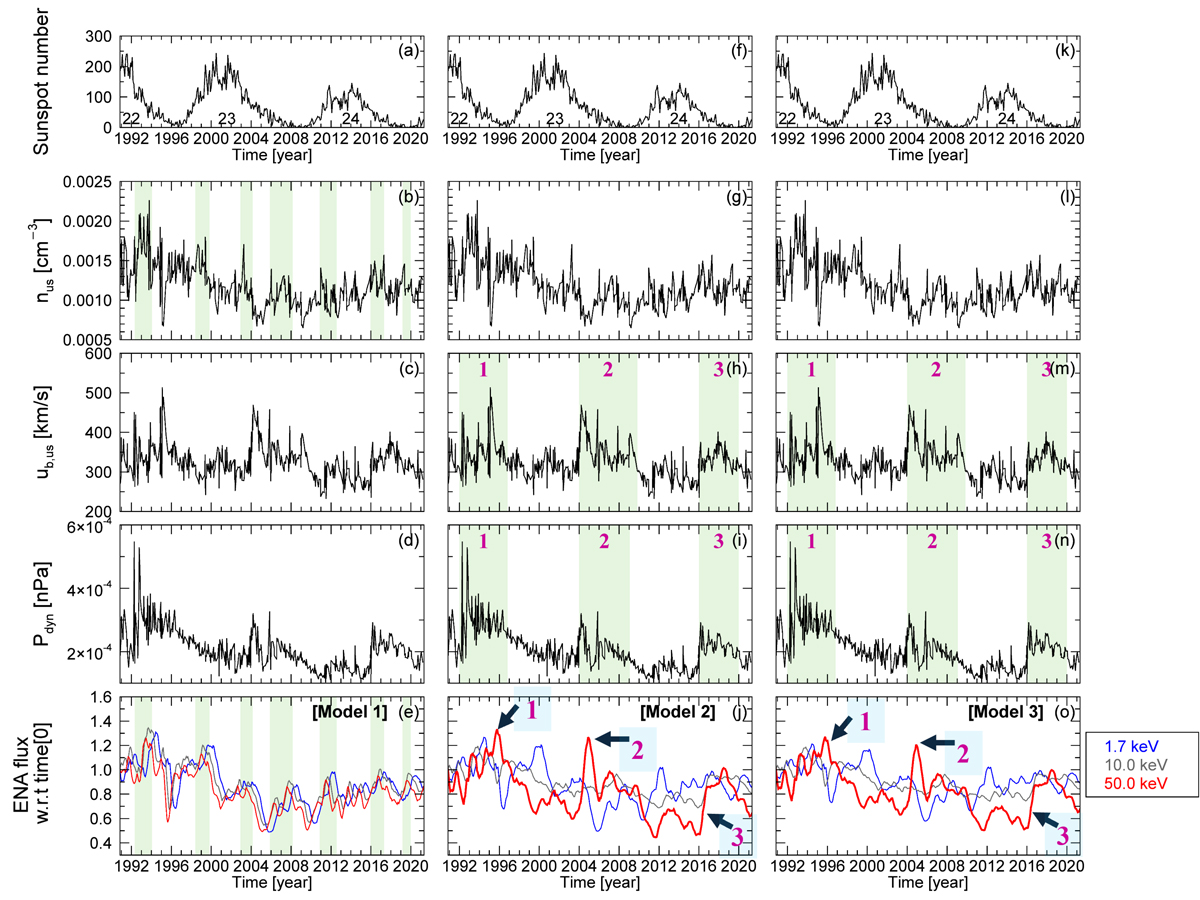
Comparison of the solar wind density (nus), bulk speed (ub, us), and dynamic pressure (Pdyn) upstream of the termination shock with the calculated ENA fluxes observed at 1 AU for three selected ENA energies. The comparison covers three ion models over a 2.5 solar cycle period. The ENA fluxes shown in the bottom panels are normalized to their values at the initial time, CR 1835 (1990-10-25 15:49 UT to 1990-11-21 23:08 UT), separately for each energy. The time [year] axis for the ENA fluxes in the bottom panels refers to the observation time at 1 AU, taking into account the time delay effect illustrated in Sect. 2, whereas the time [year] axis for the sunspot number in the top panels refers to the original time. The highlights in panels (b) and (e) indicate several major increases in number density, which align well with corresponding changes in ENA flux in Model 1. The three intervals highlighted and numbered in panels (h), (i), (m), and (n) correspond to fast solar wind and enhanced dynamic pressure conditions, which show good agreement with the 50 keV ENA flux responses in Models 2 and 3 shown in (j) and (o), respectively.
Current usage metrics show cumulative count of Article Views (full-text article views including HTML views, PDF and ePub downloads, according to the available data) and Abstracts Views on Vision4Press platform.
Data correspond to usage on the plateform after 2015. The current usage metrics is available 48-96 hours after online publication and is updated daily on week days.
Initial download of the metrics may take a while.