Fig. 4.
Download original image
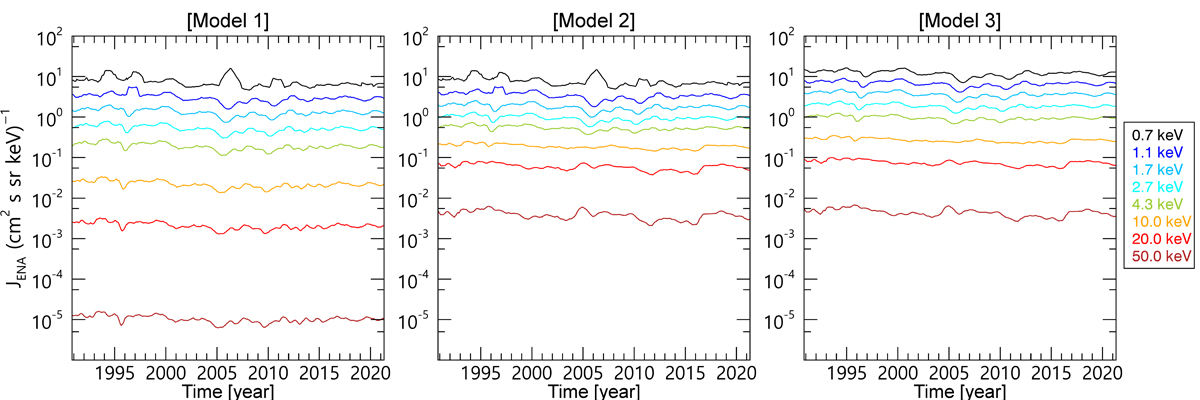
Variation of ENA fluxes at Carrington rotation time resolution across solar cycles 22, 23, and 24, with colored lines representing different ENA energies. The time on the horizontal axis refers to the observation time at 1 AU. Models 1, 2, and 3 from left to right refer to the results for three ion distribution models in the inner heliosheath.
Current usage metrics show cumulative count of Article Views (full-text article views including HTML views, PDF and ePub downloads, according to the available data) and Abstracts Views on Vision4Press platform.
Data correspond to usage on the plateform after 2015. The current usage metrics is available 48-96 hours after online publication and is updated daily on week days.
Initial download of the metrics may take a while.