Fig. 7.
Download original image
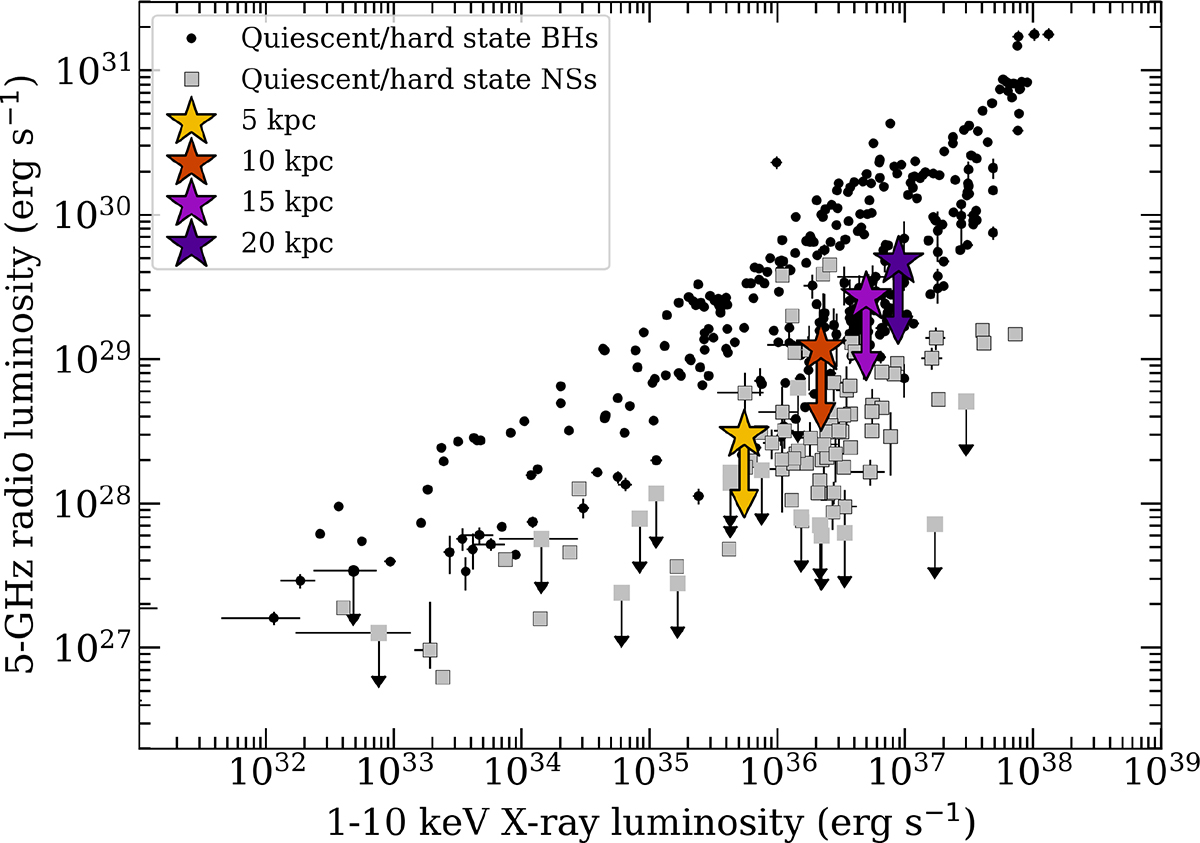
Radio–X-ray luminosity diagram of quiescent and hard state BH transients (black circles) and NS (grey squares) LMXBs, plotted using the data repository from Bahramian et al. (2018). In the plot, the X-ray luminosity of MAXI J1834–021 and the upper limit on the radio luminosity obtained by Bright et al. (2023) are plotted as stars, colour-coded for different distances.
Current usage metrics show cumulative count of Article Views (full-text article views including HTML views, PDF and ePub downloads, according to the available data) and Abstracts Views on Vision4Press platform.
Data correspond to usage on the plateform after 2015. The current usage metrics is available 48-96 hours after online publication and is updated daily on week days.
Initial download of the metrics may take a while.