Fig. 5.
Download original image
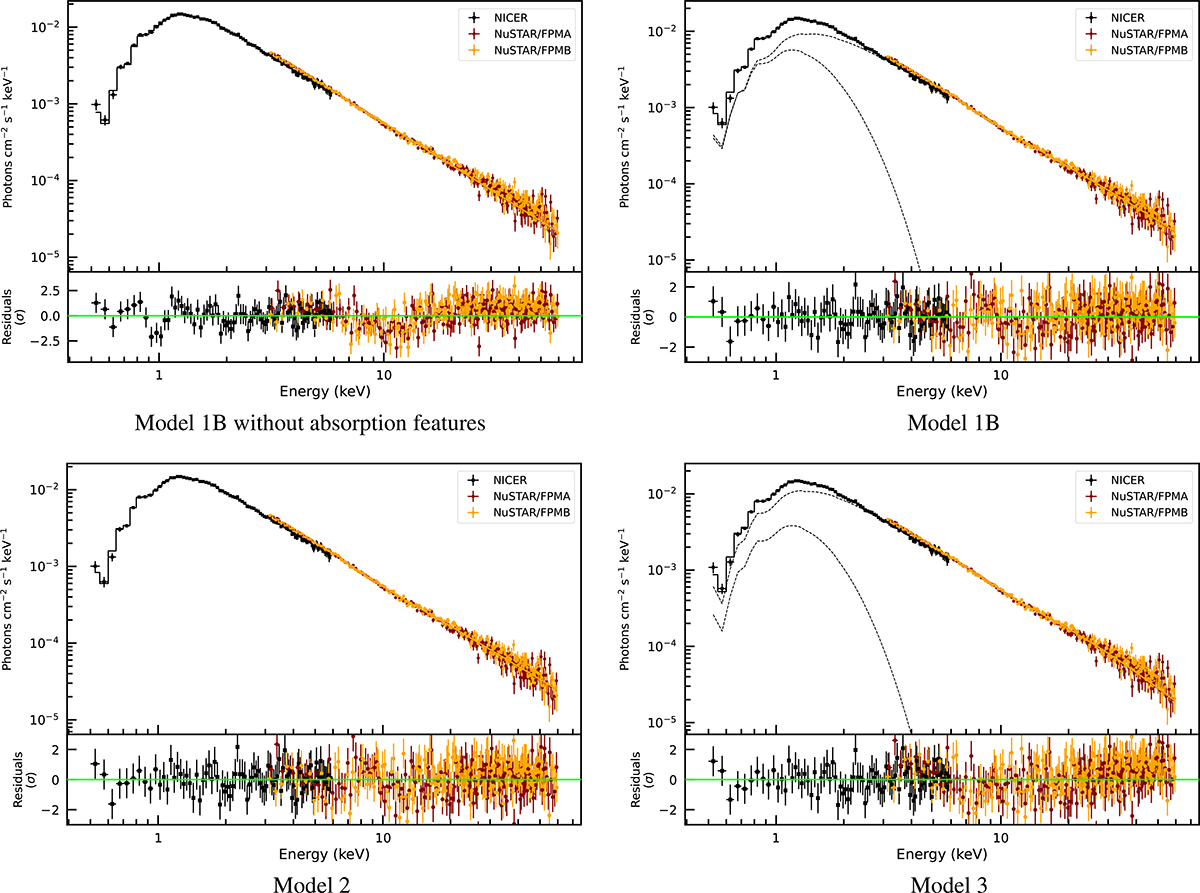
Unfolded broadband spectrum (upper panel) and fit residuals (lower panel) extracted from NICER (black) + NuSTAR/FPMA (red) + NuSTAR/FPMB (orange) data over the 0.5–60 keV energy range. Panel (a) shows the fit without the inclusion of the absorption features (TBabs(nthComp + diskbb)). Panels (b) and (c) show the fit with Model 1B (TBabs × gabs × smedge(nthComp + diskbb)) and Model 2 (TBabs × gabs × smedge × simpl × diskbb), respectively. Panel (d) shows the fit with Model 3 (TBabs × gabs(diskbb + relxillCp)).
Current usage metrics show cumulative count of Article Views (full-text article views including HTML views, PDF and ePub downloads, according to the available data) and Abstracts Views on Vision4Press platform.
Data correspond to usage on the plateform after 2015. The current usage metrics is available 48-96 hours after online publication and is updated daily on week days.
Initial download of the metrics may take a while.