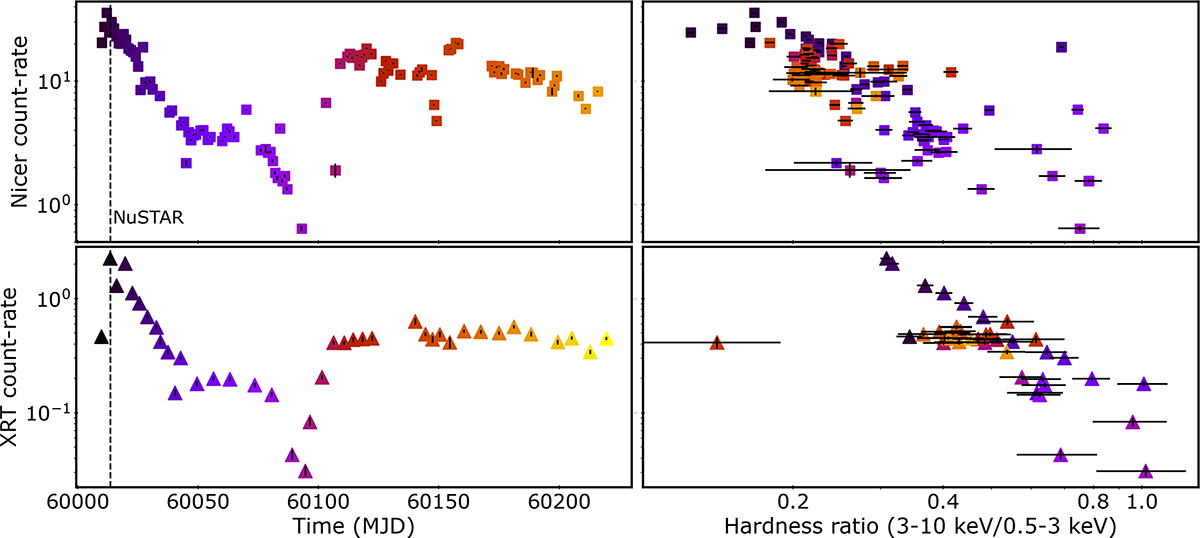
Fig. 1.
Download original image
Light curve (left panel) and HID (right panel) extracted from NICER (top) and Swift-XRT (bottom). Count rates were calculated in the 0.5–10 keV energy range, while hardness ratios were derived considering the 0.5–3 and 3–10 keV energy bands for both instruments. The colour gradient indicates the temporal sequence. Vertical dashed lines in the left panels denote the epoch of the NuSTAR observation.
Current usage metrics show cumulative count of Article Views (full-text article views including HTML views, PDF and ePub downloads, according to the available data) and Abstracts Views on Vision4Press platform.
Data correspond to usage on the plateform after 2015. The current usage metrics is available 48-96 hours after online publication and is updated daily on week days.
Initial download of the metrics may take a while.