Fig. 9.
Download original image
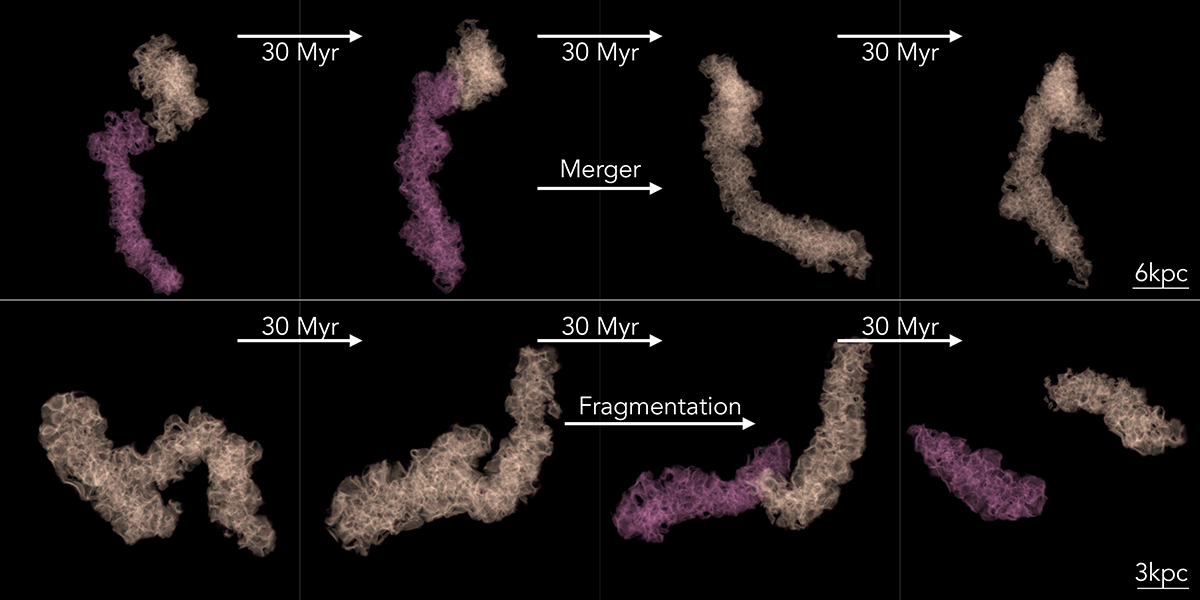
Visualization of two clouds merging into one (top row) and of a cloud fragmenting into two smaller objects (bottom row). In both rows, neighboring panels are separated in time by ∼30 Myr. The scale bars of all panels of a given row are the same, shown in the lower right of each. All panels are oriented such that the mean velocity vector of the cloud (system) is pointed toward the right. Panels with two colors show times when two distinct clouds are present, while panels with only one color contain a single cloud.
Current usage metrics show cumulative count of Article Views (full-text article views including HTML views, PDF and ePub downloads, according to the available data) and Abstracts Views on Vision4Press platform.
Data correspond to usage on the plateform after 2015. The current usage metrics is available 48-96 hours after online publication and is updated daily on week days.
Initial download of the metrics may take a while.