Fig. 8.
Download original image
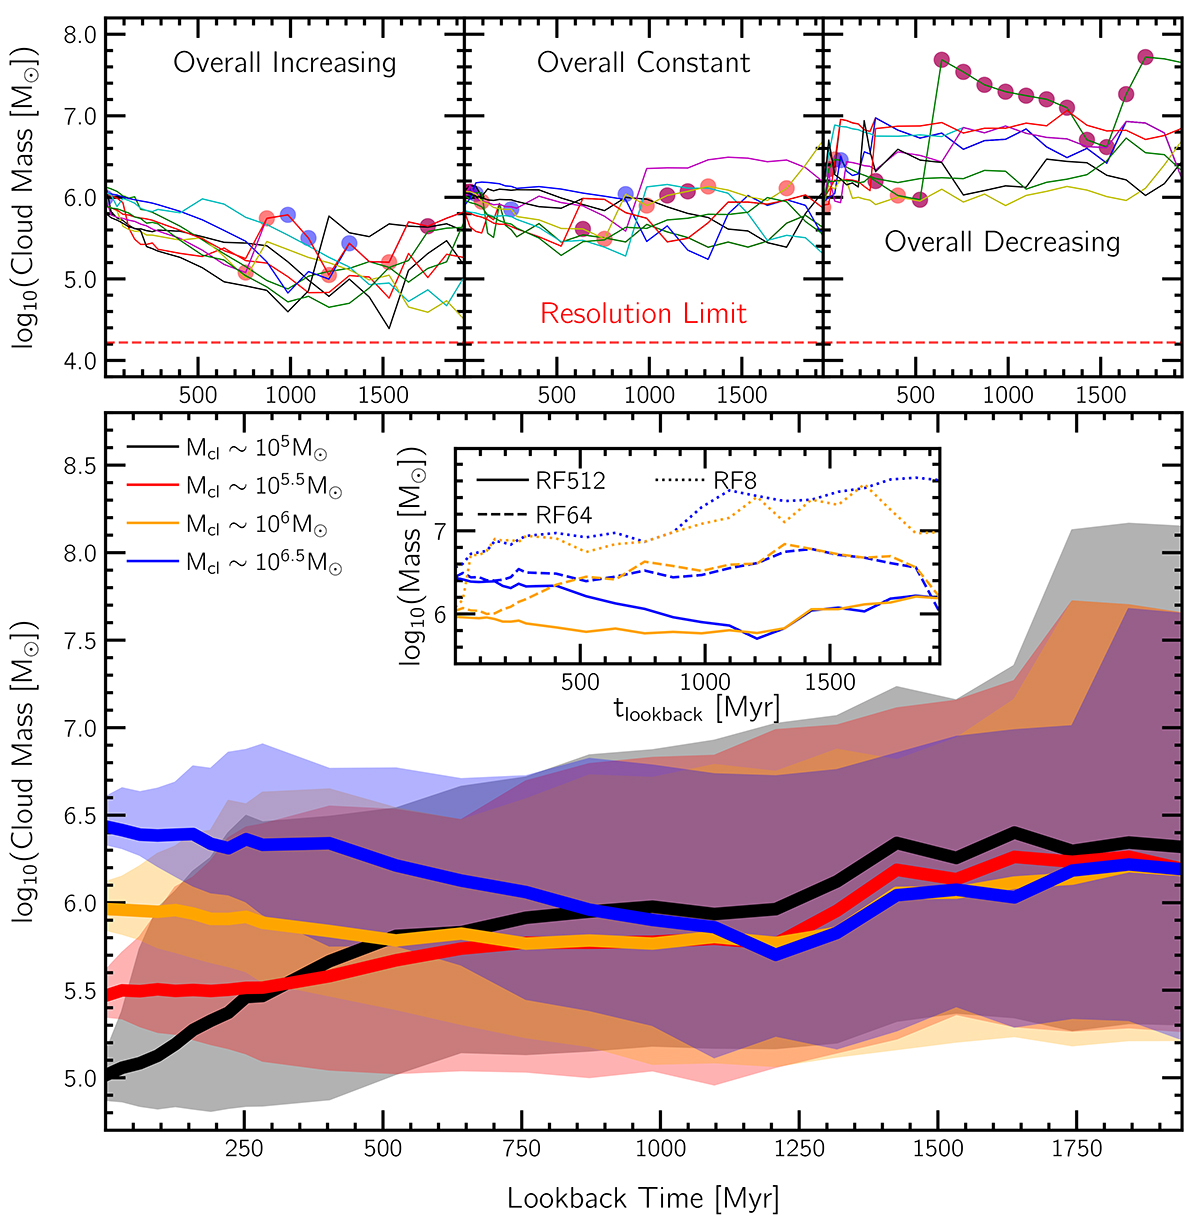
Main panel: Evolution of masses of z = 0 clouds whose main progenitors already existed ∼2 Gyr ago (z ∼ 0.15). Solid curves correspond to medians, shaded bands to the 16th-84th percentile regions, and the colors to four different mass bins. On average, progenitors of clouds from all four bins were massive (∼106.25 M⊙) 2 Gyr ago, albeit with relatively broad percentile regions in all cases. In the top panel, we show individual tracks for a subset of clouds split into three categories, chosen randomly: those whose masses have overall increased (left), remained overall constant (center) and overall decreased (right) in this time frame. For exactly one curve in each case, we show all instances of mergers and fragmentations as identified in our cloud merger trees: the former are shown in blue dots, the latter in red, and overlapping dots of both colors correspond to instances where both these events take place between neighboring snapshots. As expected, sudden jumps in curves are associated with these events. Finally, in the inset of the main panel, we assess numerical convergence by contrasting results of RF512 (solid) with the lower resolution RF64 (dashed) and RF8 (dotted) runs for the case of (z = 0) ∼106 and 106.5 M⊙ clouds. While the three runs are qualitatively similar, curves converge at a higher mass for the lower resolution runs (see text for discussion). We note that the axes labels of the inset and the top panels are identical to that of the main panel.
Current usage metrics show cumulative count of Article Views (full-text article views including HTML views, PDF and ePub downloads, according to the available data) and Abstracts Views on Vision4Press platform.
Data correspond to usage on the plateform after 2015. The current usage metrics is available 48-96 hours after online publication and is updated daily on week days.
Initial download of the metrics may take a while.