Fig. 7.
Download original image
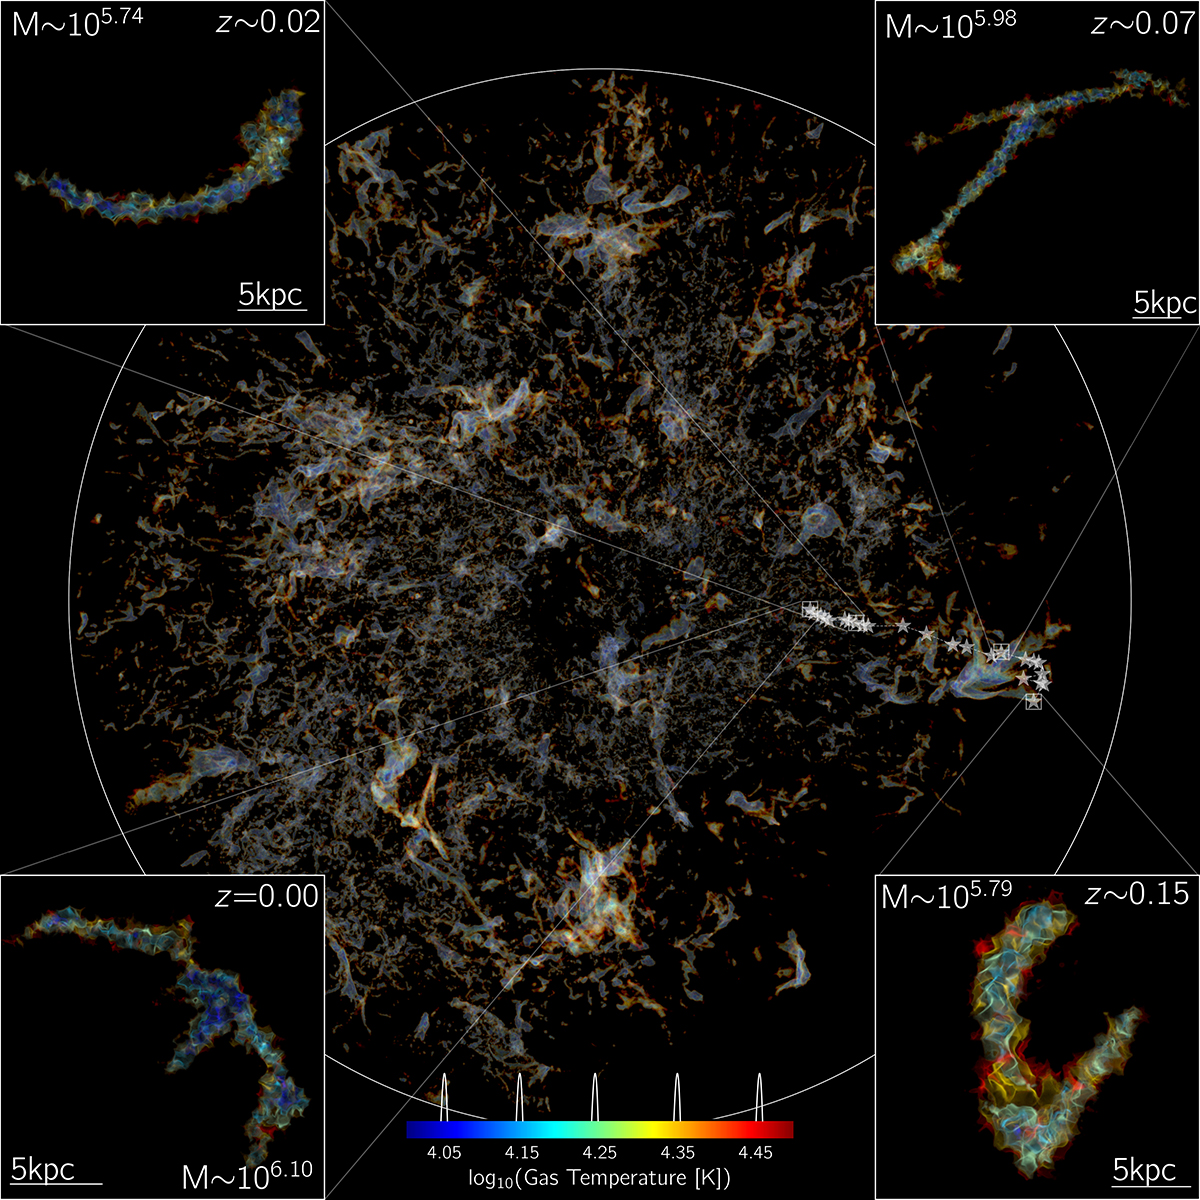
Visualization of cold clouds in a GIBLE halo (S98; see Table 2 of Ramesh & Nelson 2024 for more details) at z = 0 using a ray-traced volume rendering sampled by five narrow Gaussian transfer functions in temperature space, as shown by the color bar (background image). The white circle denotes the outer boundary of the CGM refinement region, i.e. the virial radius of the halo (∼270 kpc). In the foreground, we show the (past) trajectory of a ∼106.1 M⊙ cloud identified at z = 0, with the various translucent stars highlighting the positions of the main progenitor of this cloud at 25 distinct snapshots back to z ∼ 0.15. The insets at the corners of the image show a volume rendering of (the main progenitor of) this cloud at four distinct redshifts, going back in time in clockwise direction starting from the bottom left, with the cloud oriented such that its mean velocity vector points to the right. In the ∼2 Gyr between z ∼ 0.15 and 0, this cloud clearly evolves in terms of shape, size (characterized by the varying scale bars in the insets) and mass (shown by the different labels; in units of M⊙). Also visible in the top-right inset is an instance of an ongoing merger between clouds, a phenomenon explored and quantified later in this paper.
Current usage metrics show cumulative count of Article Views (full-text article views including HTML views, PDF and ePub downloads, according to the available data) and Abstracts Views on Vision4Press platform.
Data correspond to usage on the plateform after 2015. The current usage metrics is available 48-96 hours after online publication and is updated daily on week days.
Initial download of the metrics may take a while.