Fig. B.1.
Download original image
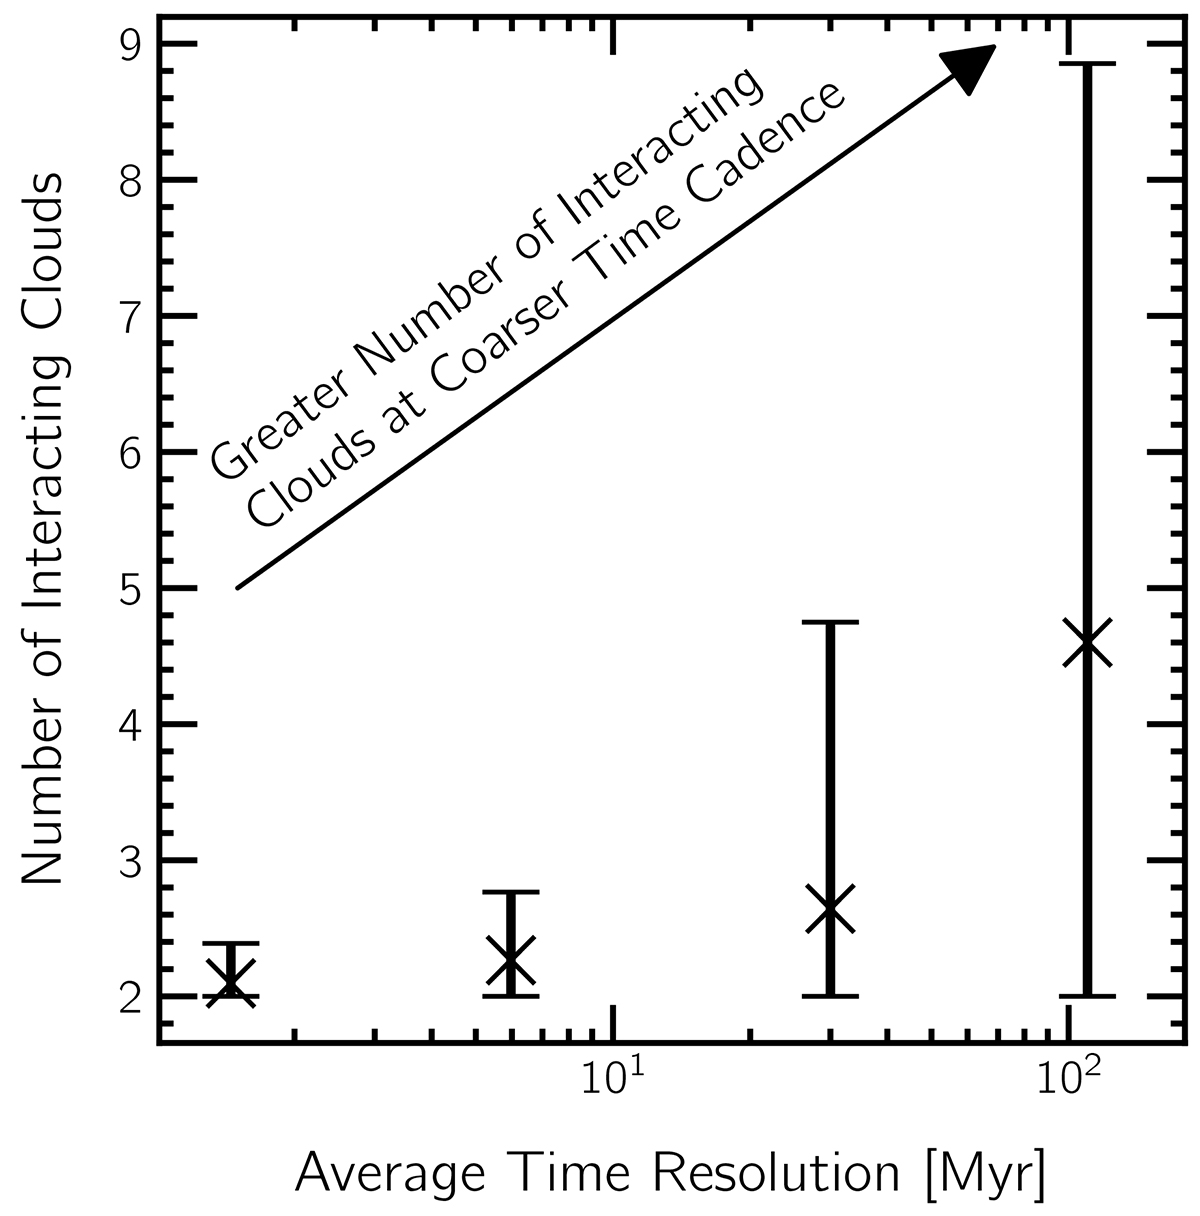
Number of clouds that interact during a merger event between two neighboring snapshots (y-axis) as a function of time cadence (x-axis). Crosses show the mean, while error bars correspond to the 1σ variation. While the average is ∼ 5 when the snapshot cadence is as coarse as ∼ 100 Myr, it is close to 2 at out best available snapshot spacing, suggesting that all pairwise merger events are correctly identified.
Current usage metrics show cumulative count of Article Views (full-text article views including HTML views, PDF and ePub downloads, according to the available data) and Abstracts Views on Vision4Press platform.
Data correspond to usage on the plateform after 2015. The current usage metrics is available 48-96 hours after online publication and is updated daily on week days.
Initial download of the metrics may take a while.