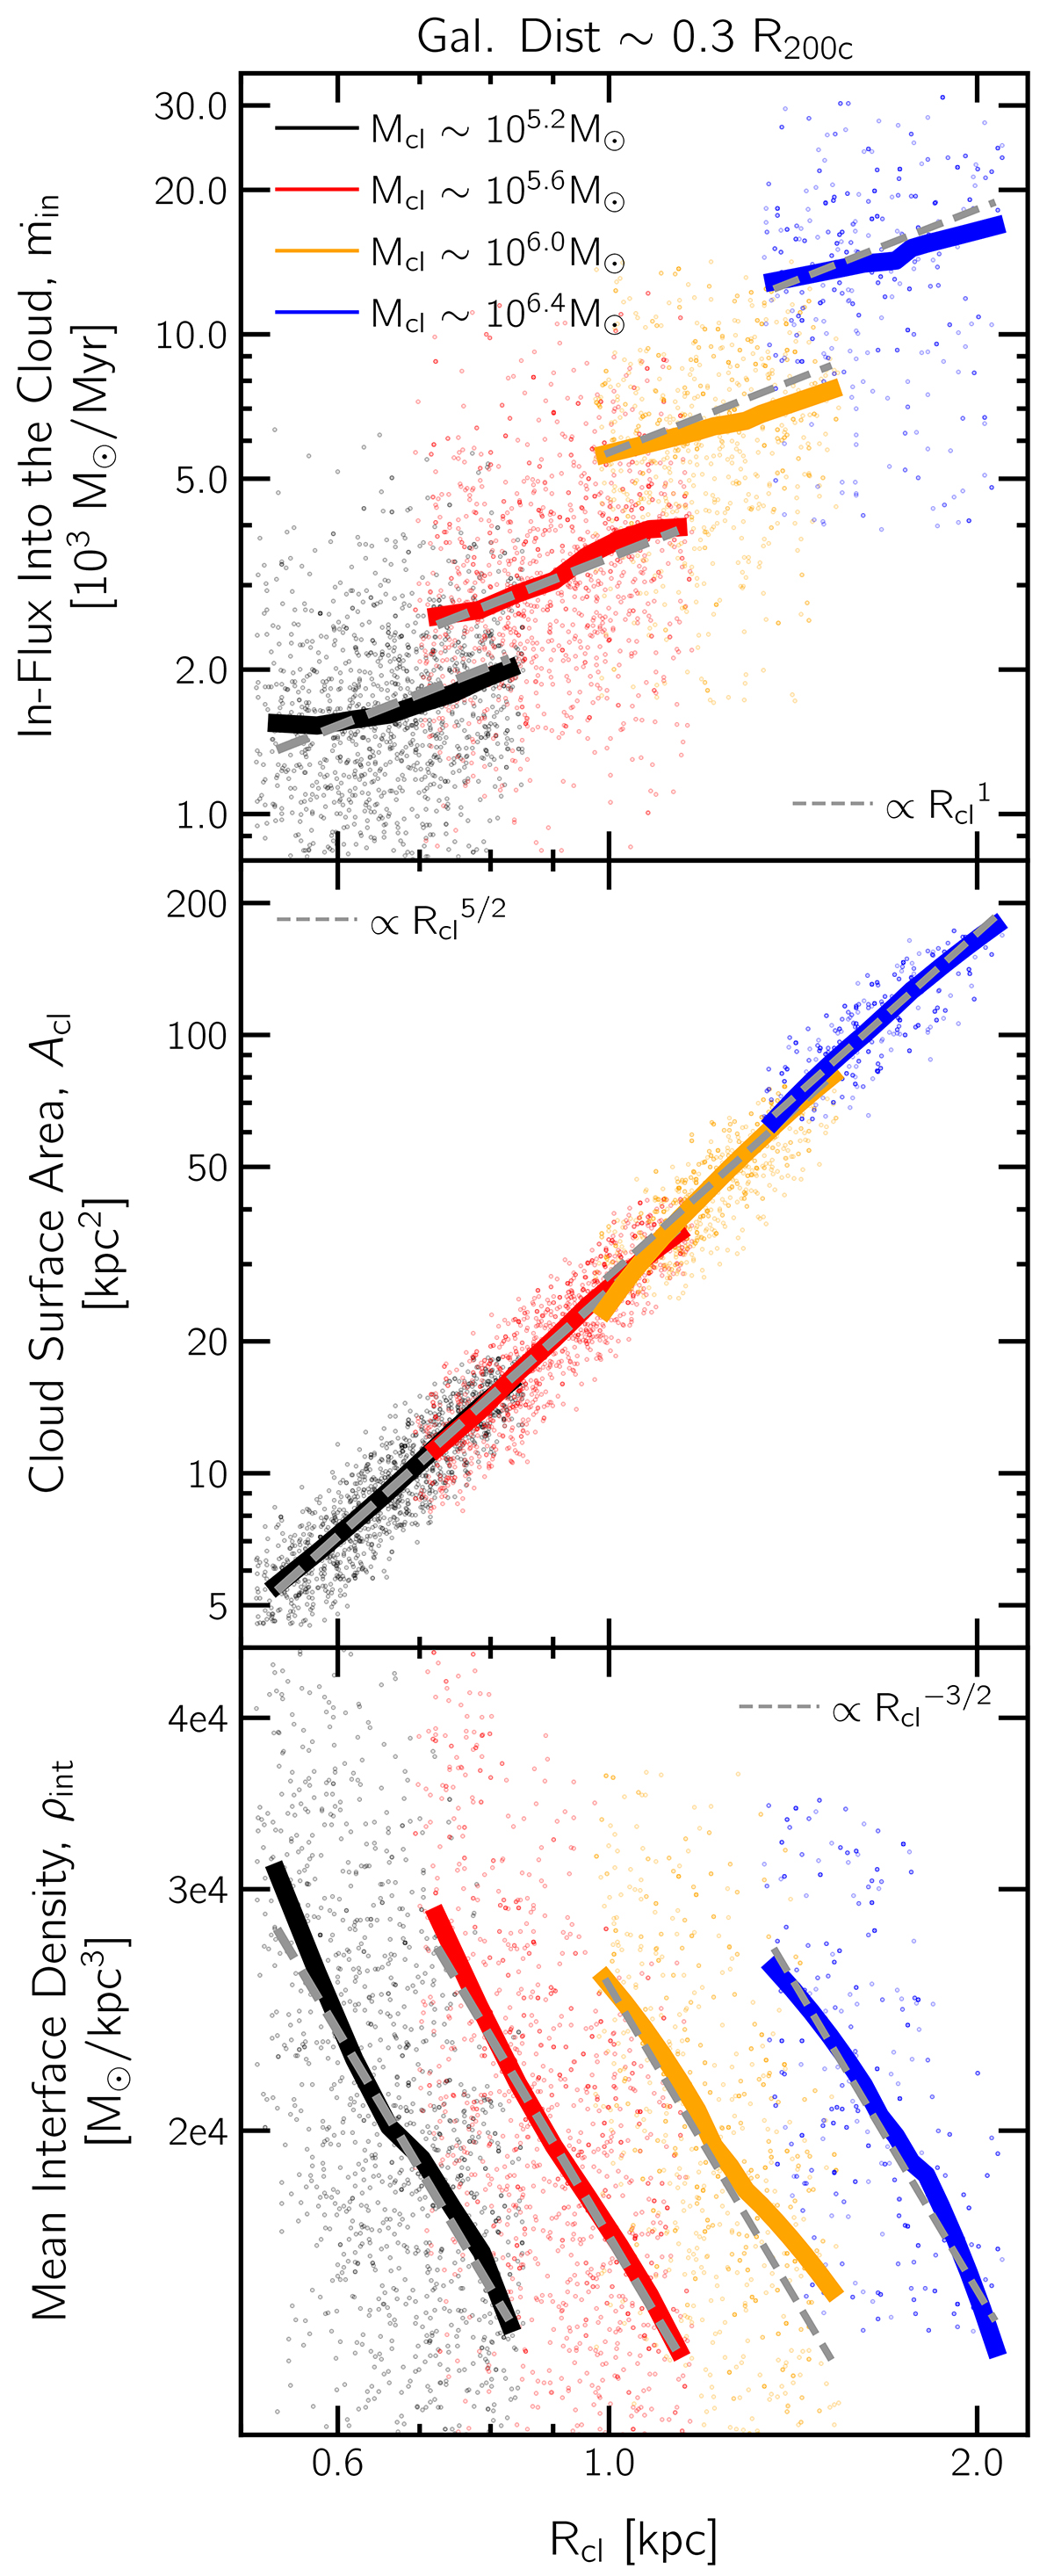
Fig. 14.
Download original image
Mass in-flux (top panel), cloud surface area (center), and mean interface density (lower) as a function of radius for clouds in the inner halo (galactocentric distance ∼0.3 R200c). The various solid colored curves correspond to median relations for clouds segregated into different mass bins, scatter points to individual clouds, and the dashed gray lines to relevant scaling relations. See main text for more discussion.
Current usage metrics show cumulative count of Article Views (full-text article views including HTML views, PDF and ePub downloads, according to the available data) and Abstracts Views on Vision4Press platform.
Data correspond to usage on the plateform after 2015. The current usage metrics is available 48-96 hours after online publication and is updated daily on week days.
Initial download of the metrics may take a while.