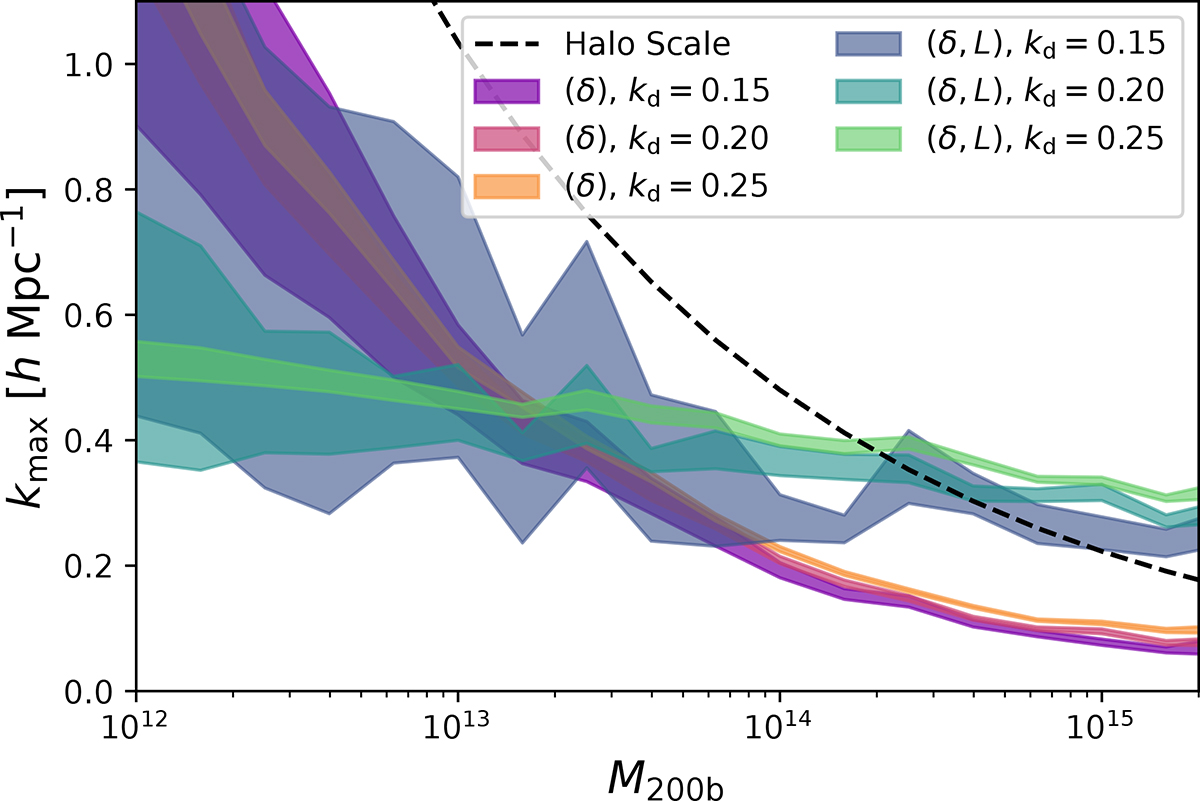
Fig. 9.
Download original image
Maximum damping scale where the PBS can be valid and bias scale-independent. The three reddish contours show the break-down scale of density-only bias models, estimated with bias parameters measured at different scales, and the three green-blueish contours show it for (δ, L) bias models. The black dashed line shows the wavenumber associated with the Lagrangian radius of halos. The break-down scale is consistent across different measurements and only seems to scale strongly with halo radius for the (δ) case.
Current usage metrics show cumulative count of Article Views (full-text article views including HTML views, PDF and ePub downloads, according to the available data) and Abstracts Views on Vision4Press platform.
Data correspond to usage on the plateform after 2015. The current usage metrics is available 48-96 hours after online publication and is updated daily on week days.
Initial download of the metrics may take a while.