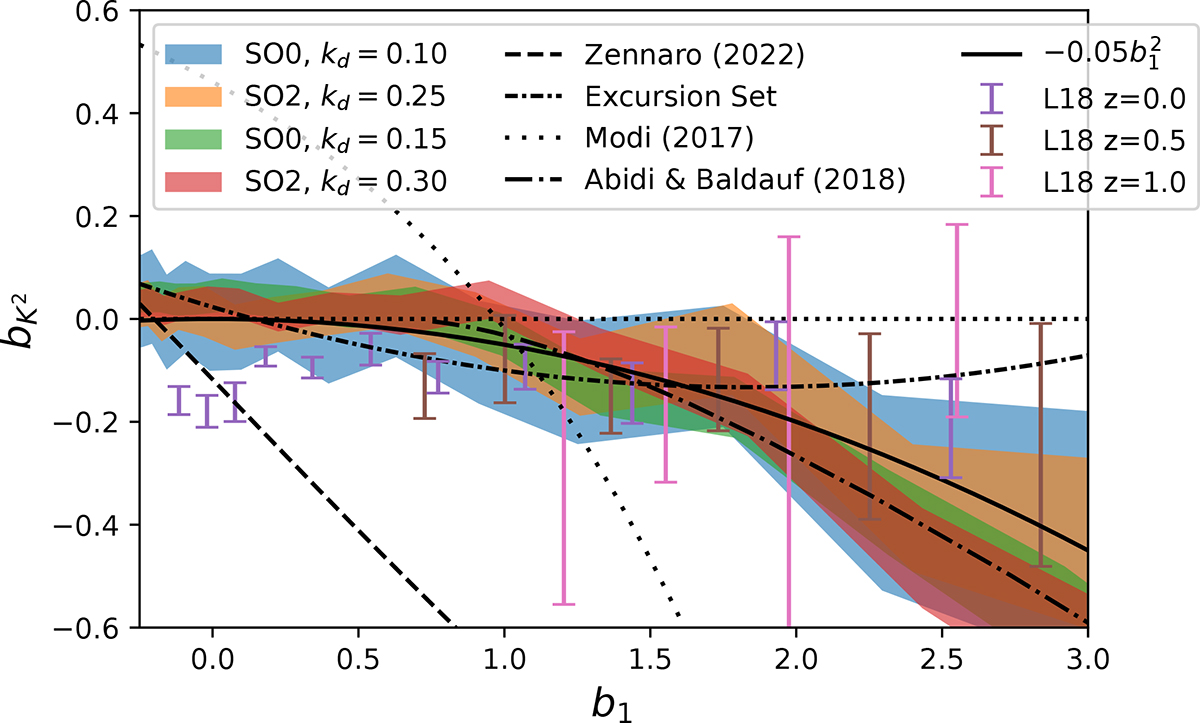
Fig. 12.
Download original image
Co-evolution relation bK2 versus b1. Coloured shaded regions are our measurements and error bars show the measurements from Lazeyras & Schmidt (2018). Black lines include measurements from Zennaro et al. (2022), Modi et al. (2017) and Abidi & Baldauf (2018), an excursion set prediction from Sheth et al. (2013) and an approximation that we propose as bK2 = −0.05b12.
Current usage metrics show cumulative count of Article Views (full-text article views including HTML views, PDF and ePub downloads, according to the available data) and Abstracts Views on Vision4Press platform.
Data correspond to usage on the plateform after 2015. The current usage metrics is available 48-96 hours after online publication and is updated daily on week days.
Initial download of the metrics may take a while.