Fig. 1.
Download original image
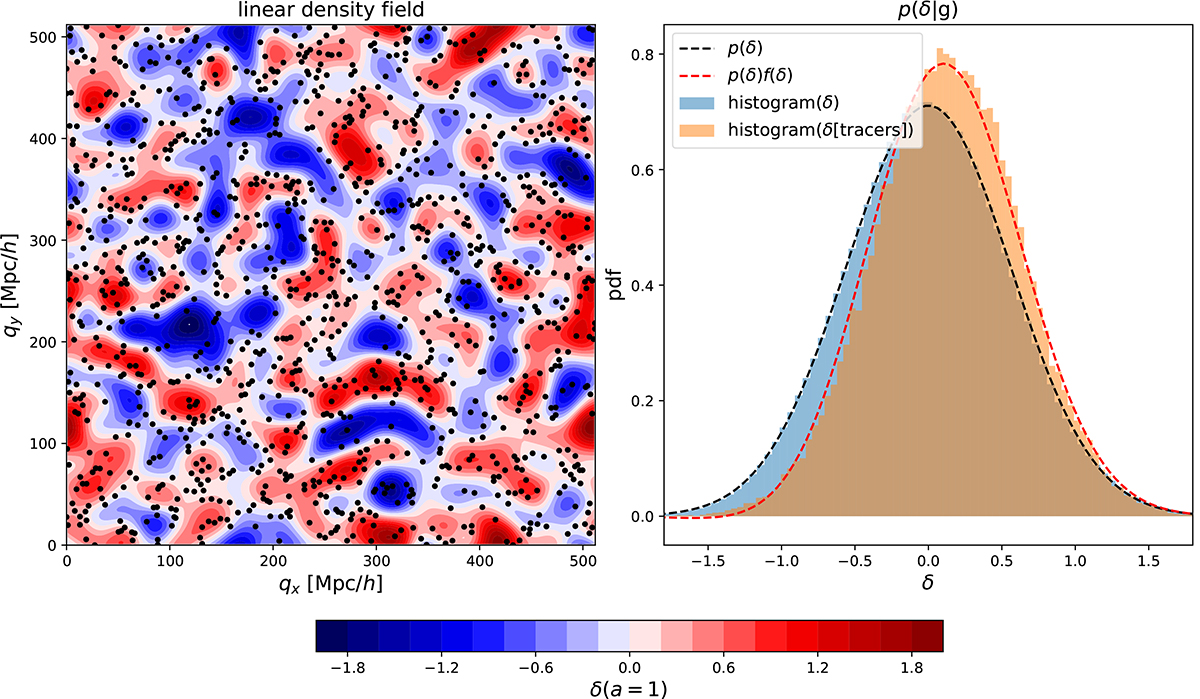
Illustration of the inference of the halo environment distribution p(δ|g). Left: Galaxies traced back to their origin in Lagrangian space (marked as black dots) and with the (smoothed) linear density field, δ, inferred at their Lagrangian locations. Right: Environment distribution (orange histogram) given by the distribution of δ at the galaxy locations which is notably biased relative to the matter distribution, p(δ), (blue histogram and a Gaussian represented as dashed line). The galaxy environment distribution is well approximated through p(δ)f(δ), where here f(δ) is a quadratic polynomial bias function.
Current usage metrics show cumulative count of Article Views (full-text article views including HTML views, PDF and ePub downloads, according to the available data) and Abstracts Views on Vision4Press platform.
Data correspond to usage on the plateform after 2015. The current usage metrics is available 48-96 hours after online publication and is updated daily on week days.
Initial download of the metrics may take a while.