Fig. 5.
Download original image
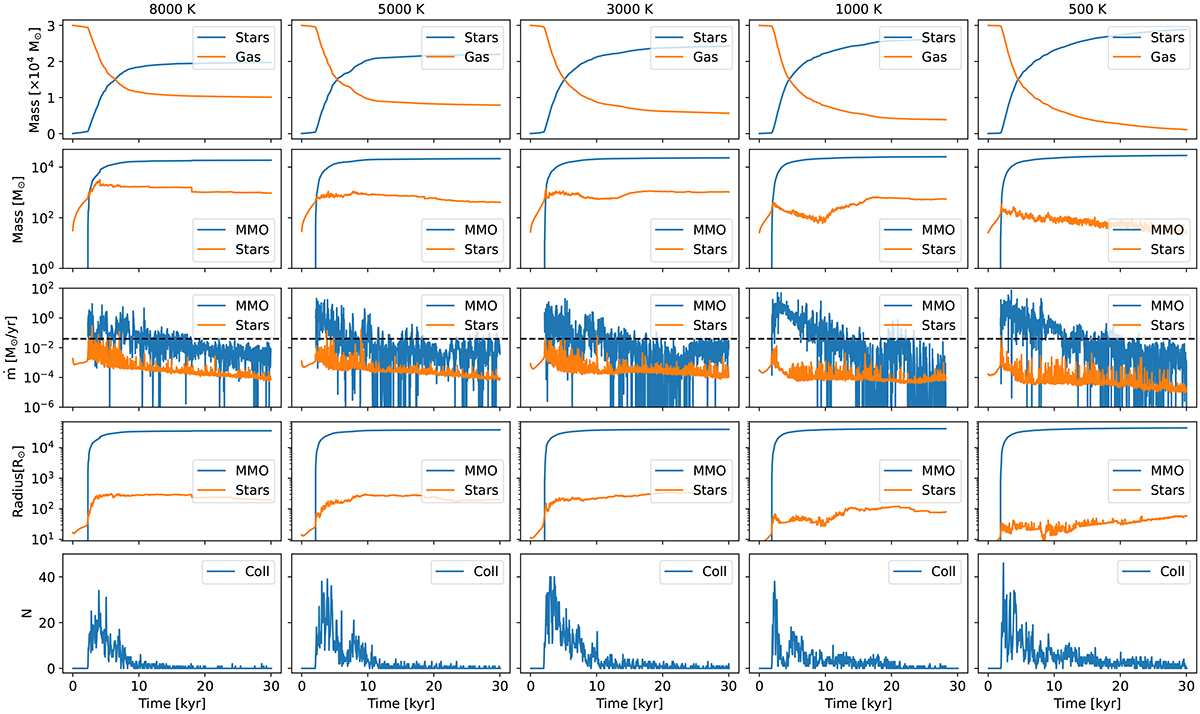
Evolution of the gas and protostellar mass in the simulations with different temperatures (top panel). Comparison of the time evolution of the MMO mass and the total mass of the protostars without the MMO (second panel), accretion rate of the MMO with the mean accretion rate of the protostars without the MMO (third panel), where the black dashed line is the critical accretion rate ṁcrit = 0.04 M⊙ yr−1 and marks the point where the protostars pass to the SMS Track. We further show the radius of the MMO with the mean radii of the protostars (fourth panel) and the evolution of the total collision rates over time (bottom panel).
Current usage metrics show cumulative count of Article Views (full-text article views including HTML views, PDF and ePub downloads, according to the available data) and Abstracts Views on Vision4Press platform.
Data correspond to usage on the plateform after 2015. The current usage metrics is available 48-96 hours after online publication and is updated daily on week days.
Initial download of the metrics may take a while.