Open Access
Fig. 4.
Download original image
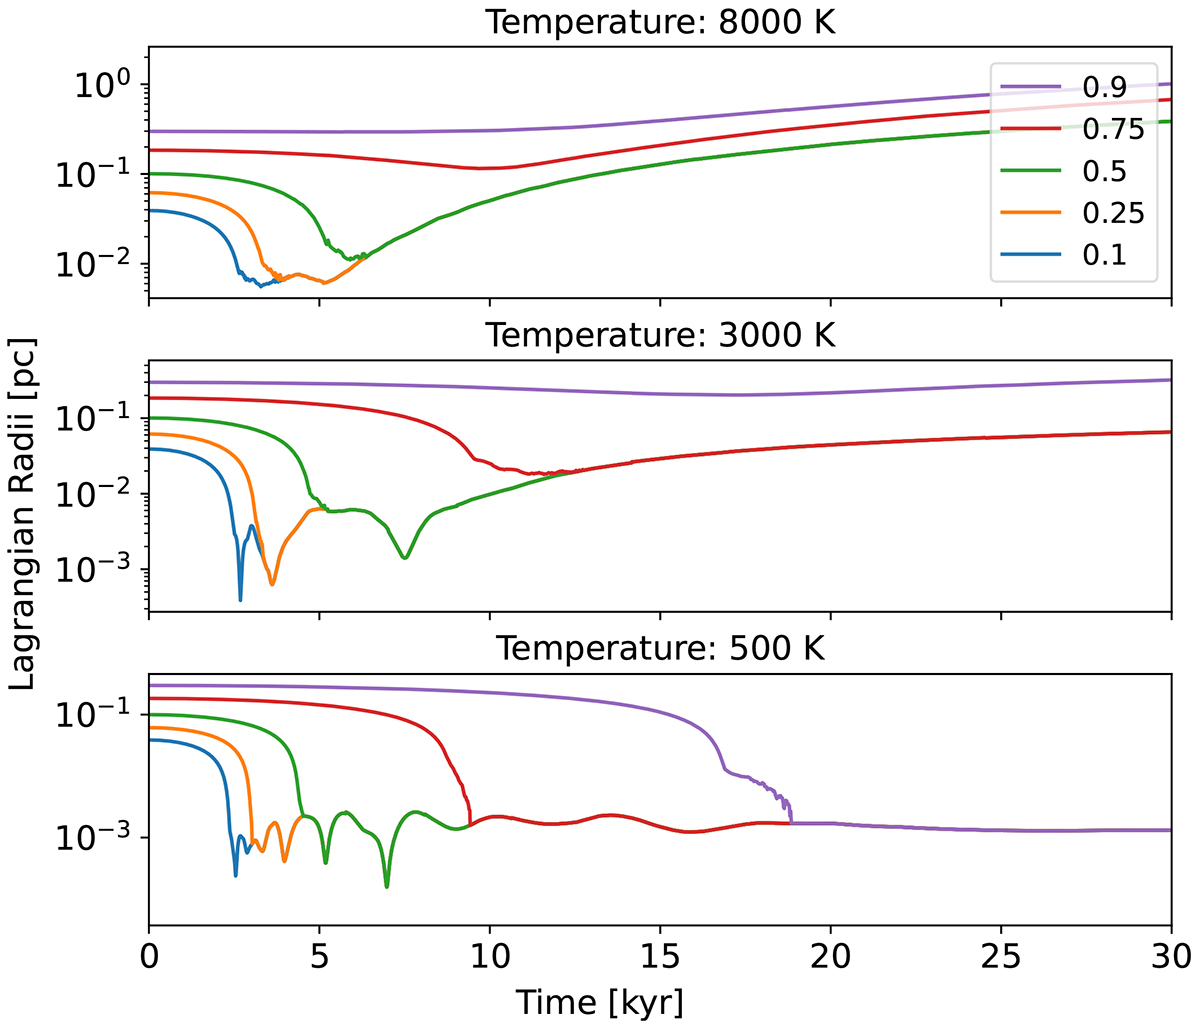
Time evolution of the 90%, 75%, 50%, 25%, and 10% Lagrangian radii for our simulations with temperatures of 8000 K, 3000 K, and 500 K. The panels show the Lagrangian radii considering the total mass of the systems (gas and stars) relative to their centers of mass.
Current usage metrics show cumulative count of Article Views (full-text article views including HTML views, PDF and ePub downloads, according to the available data) and Abstracts Views on Vision4Press platform.
Data correspond to usage on the plateform after 2015. The current usage metrics is available 48-96 hours after online publication and is updated daily on week days.
Initial download of the metrics may take a while.