Fig. 3.
Download original image
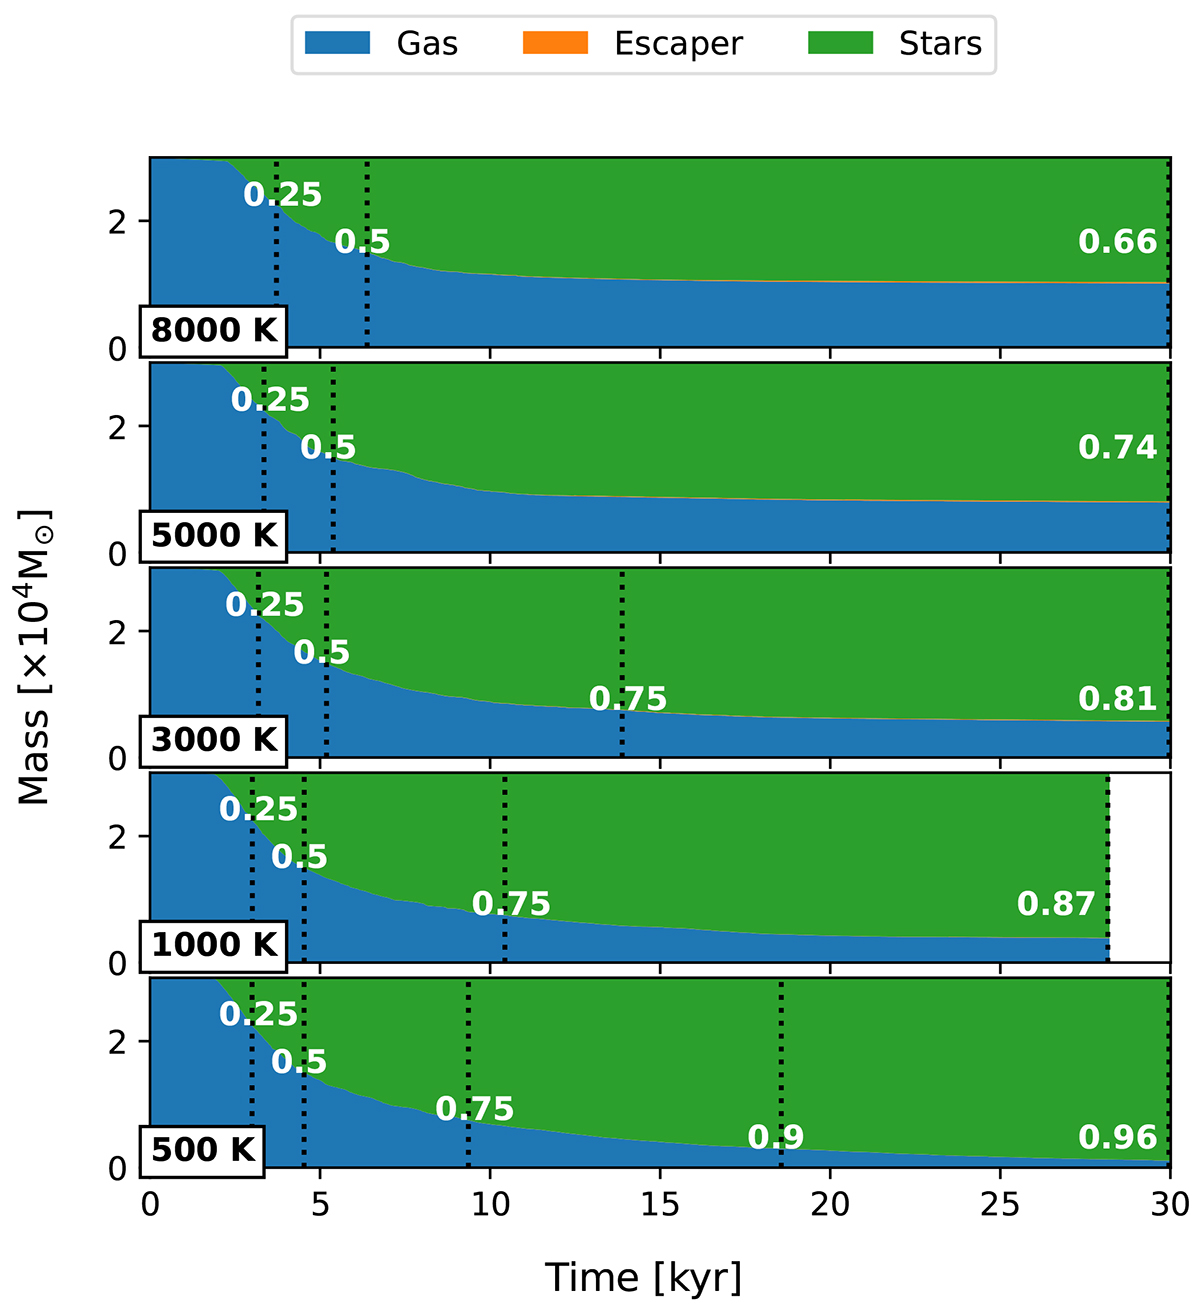
Time evolution of the mass fraction for the simulations with an initial temperature of 8000 K, 5000 K, 3000 K, 1000 K, and 500 K, corresponding to the gas mass (blue zone), protostars in the cluster (green zone) and the escaped protostellar mass (orange zone). The vertical dotted black lines indicate the times when the protostars accreted 25%, 50%, and 75% of the gas mass.
Current usage metrics show cumulative count of Article Views (full-text article views including HTML views, PDF and ePub downloads, according to the available data) and Abstracts Views on Vision4Press platform.
Data correspond to usage on the plateform after 2015. The current usage metrics is available 48-96 hours after online publication and is updated daily on week days.
Initial download of the metrics may take a while.