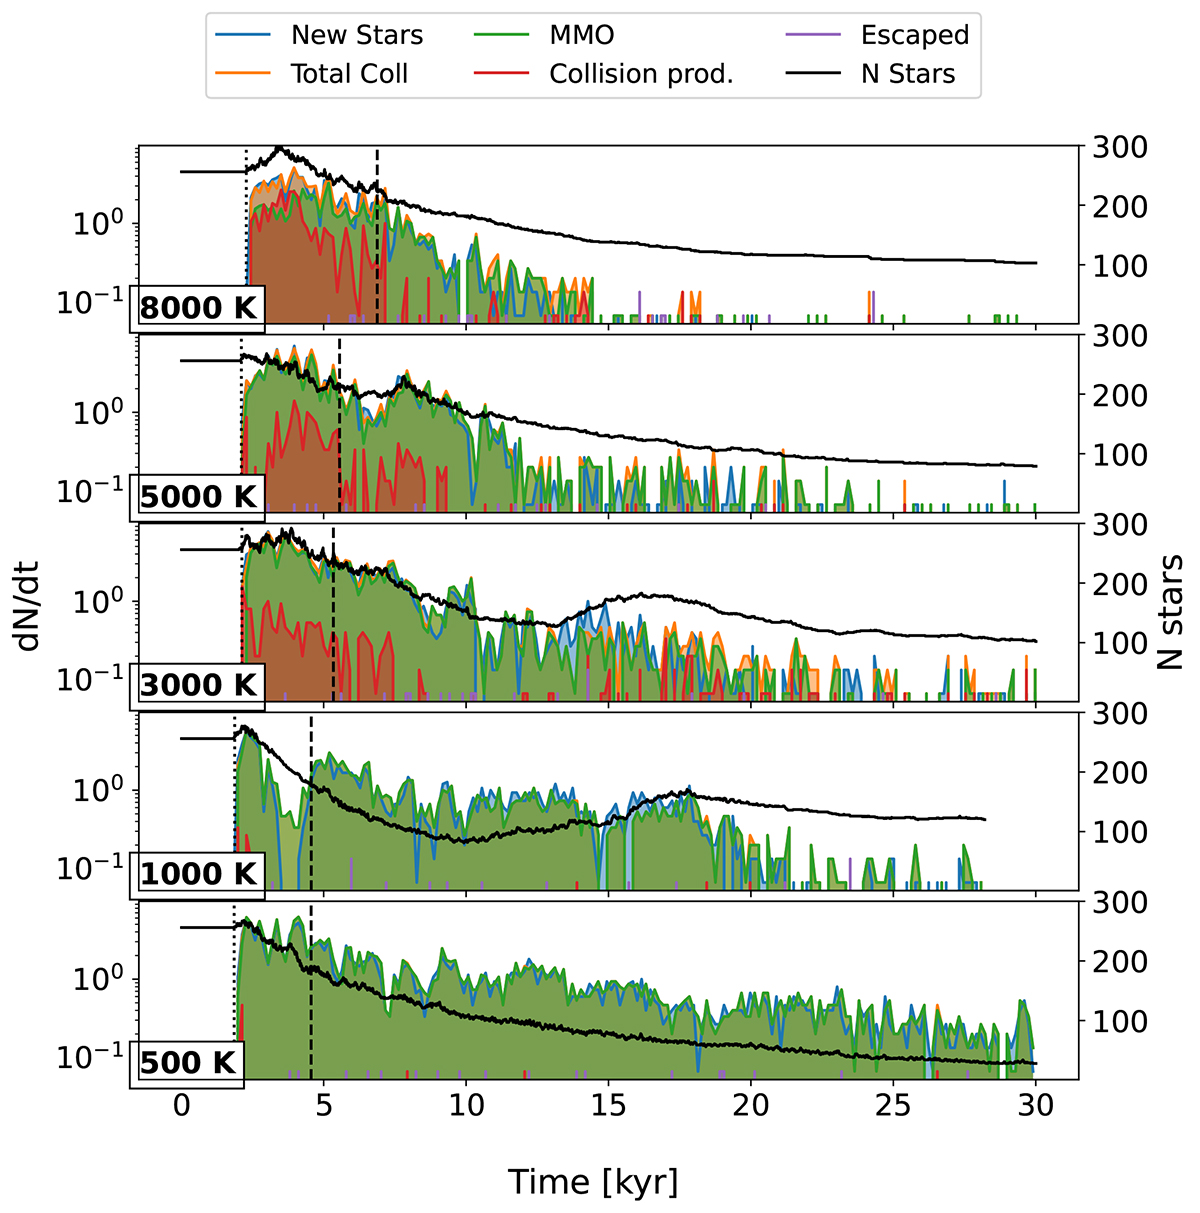
Fig. 12.
Download original image
Time evolution of five rate categories: (1) Formation rate (blue; new stars), (2) total collision rate (orange; total coll.), (3) rate of stars that collided with the MMO (green; MMO), (4) rate of stars that are part of other collision products (red; collision prod.), and (5) rate of stars that escaped from the cluster (purple; escaped). The solid black line shows the number of stars. The vertical dotted and dashed black lines indicate the birth of the MMO and the moment at which the system is dominated by the stellar mass Mstars > Mgas.
Current usage metrics show cumulative count of Article Views (full-text article views including HTML views, PDF and ePub downloads, according to the available data) and Abstracts Views on Vision4Press platform.
Data correspond to usage on the plateform after 2015. The current usage metrics is available 48-96 hours after online publication and is updated daily on week days.
Initial download of the metrics may take a while.