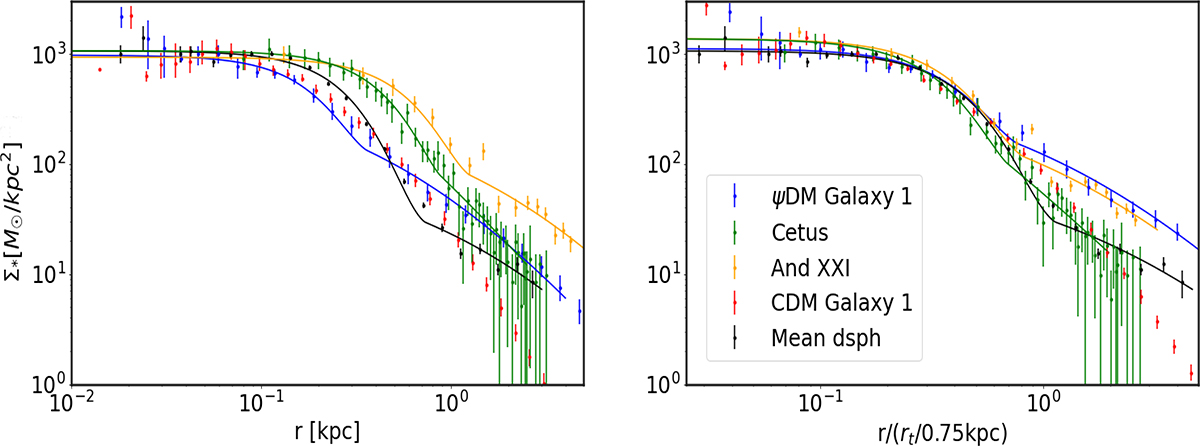
Fig. 7.

Download original image
Comparison of stellar profiles from various galaxies. Specifically, it compares the stellar profile of the ψDM and CDM isolated Galaxy (G1 from Figure 1), the mean profile of all dSphs in the Local Group (Pozo et al. 2023), and the projected density profiles of two galaxies from Andromeda and the Milky Way that have the most similar density gap between the core and the transition point when compared to G1. In the left panel, the four profiles are normalized based on their peak density values. In the right panel, they are additionally normalized with respect to the transition point. Notably, the extracted profile from the data (represented by the blue line) exhibits a shape very similar to the extracted profiles of the real observable galaxies. Furthermore, this data's profile appears to coincide extremely well with the profile of Andromeda XXI. We note that even the CDM profile of Galaxy 1 aligns well with the inner parts of other galaxies. However, the absence of any transition point in the CDM profile of Galaxy 1 makes it incompatible with observed cases, in contrast to the ψDM profile.
Current usage metrics show cumulative count of Article Views (full-text article views including HTML views, PDF and ePub downloads, according to the available data) and Abstracts Views on Vision4Press platform.
Data correspond to usage on the plateform after 2015. The current usage metrics is available 48-96 hours after online publication and is updated daily on week days.
Initial download of the metrics may take a while.


