Fig. 6.
Download original image
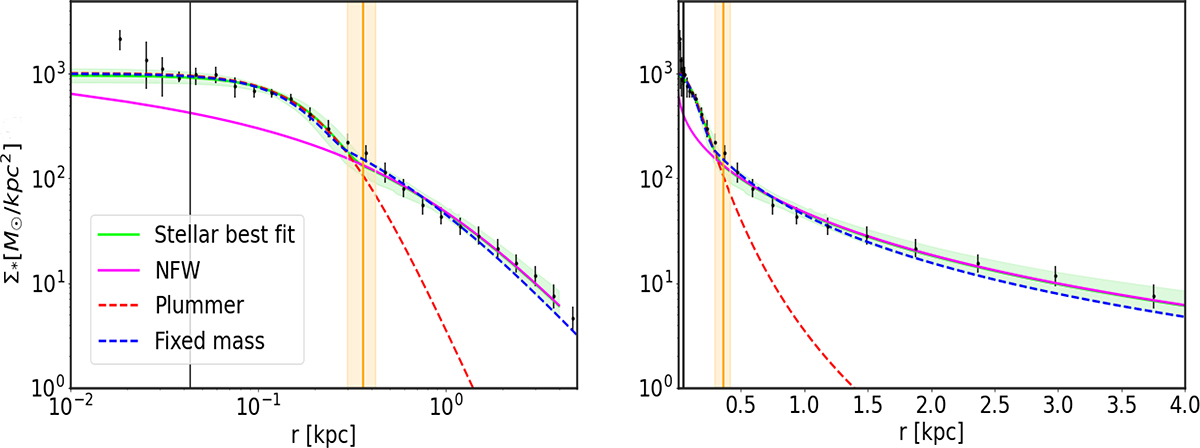
Isolated ψDMG1 (z = 5.56). This figure presents the best-fit projected star count profile of the ψDM isolated dwarf Galaxy, specifically G1 from Figure 1. The plot reveals an extended halo of stars, reaching approximately 4 kpc, which is most prominently displayed in the linear scale representation on the right panel. Additionally, a distinct core is evident on a scale smaller than 0.5 kpc. These characteristics closely align with the observed stellar profiles of real dwarf spheroidal galaxies in the Local Group (Pozo et al. 2023) and are consistent with the recently detected extended stellar halos in several local dwarfs (Chiti et al. 2021; Collins et al. 2021; Torrealba et al. 2019). A standard Plummer profile (indicated by a red dashed curve) approximately fits the core region but falls significantly short at larger radii. Our predictions for the dSph class (2.5×10⁻²² eV) in ψDM are depicted in green (representing the 2σ range of the posterior distribution of profiles), where the distinctive soliton profile provides an excellent fit to the observed cores and the surrounding halo of excited states. This averages azimuthally to an approximately NFW-like profile beyond the soliton radius. The accuracy of the core fit to the soliton is best visualized on a logarithmic scale in the left panel, while the right panel demonstrates the extent of the halo, including the characteristic density drop of approximately a factor of 30 predicted by ψDM between the prominent core and the tenuous halo at a radius of around 0.5 kpc, indicated by the vertical orange band. The blue dashed curve represents our prediction with a fixed mass of 8.3×10⁹ M⊙, which exactly matches the calculated mass by Mocz et al. (2020) for this Galaxy at this redshift. The vertical black line represents the comoving resolution limit of the data, indicating that values smaller than this limit should be treated with caution due to their potentially unreliable nature. This is why we did not take them into account for the fitting.
Current usage metrics show cumulative count of Article Views (full-text article views including HTML views, PDF and ePub downloads, according to the available data) and Abstracts Views on Vision4Press platform.
Data correspond to usage on the plateform after 2015. The current usage metrics is available 48-96 hours after online publication and is updated daily on week days.
Initial download of the metrics may take a while.